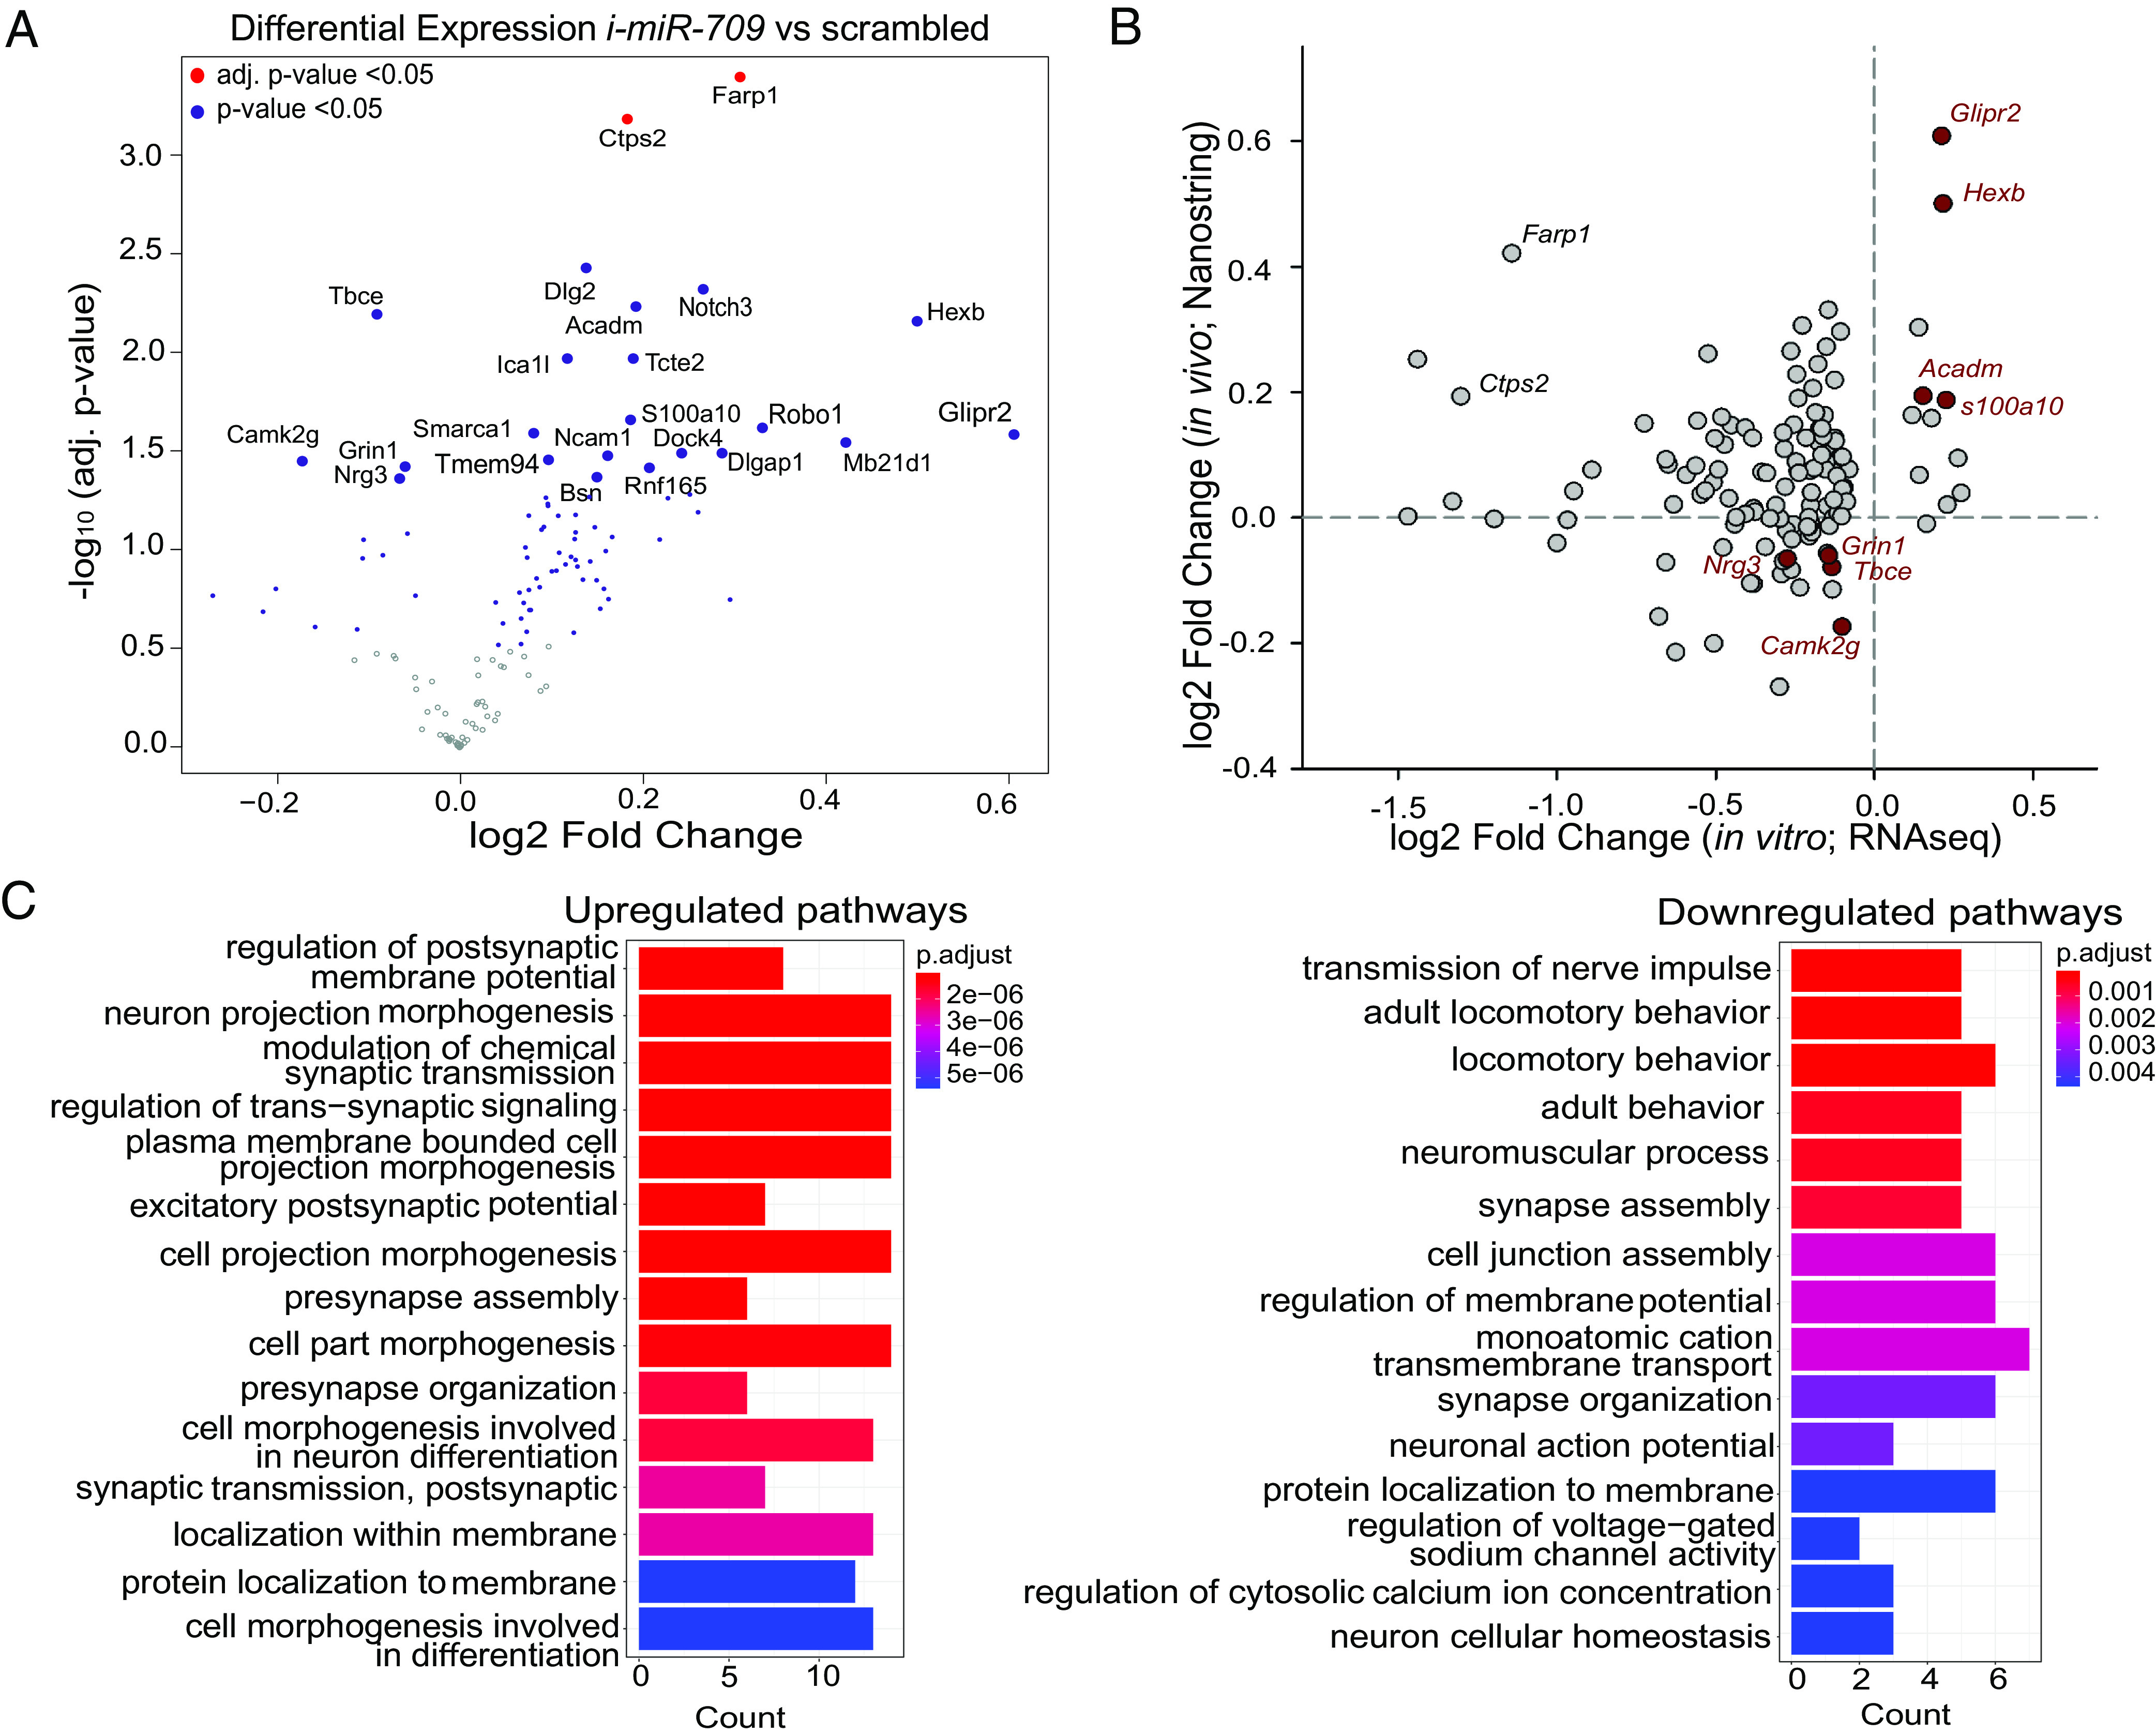
Fig. 6.

Differential gene expression after SD in the cortex of i-miR-709 treated animals. Expression levels of the 107 out of 111 differentially regulated genes from the in vitro miR-709 inhibition experiment were assessed in the cortical tissue of i-miR-709- (n = 4) or scrambled- (n = 5) injected animals after 6 h SD. (A) Volcano plot of differential gene expression between the two groups, displaying the log2 fold-change and the respective –log10 P-value for each individual gene. Genes with significantly altered expression (inhibited vs. scrambled) are depicted by the blue (t test, P-value < 0.05) and red (FDR < 0.05) dots. (B) Correlation between expression levels of the top 107 genes in the in vitro and in vivo miR-709 inhibition experiment. Note that four genes are found to be commonly up- and four downregulated in both datasets. (C) GO overrepresentation analysis (ORA) using the clusterProfiler package (Materials and Methods) for all up- (Left) and downregulated (Right) genes. Bar width of enriched terms is expressed as counts of participating genes. Bars are colored according to statistical significance (Benjamini–Hochberg multiple correction; P < 0.05; q < 0.05).
