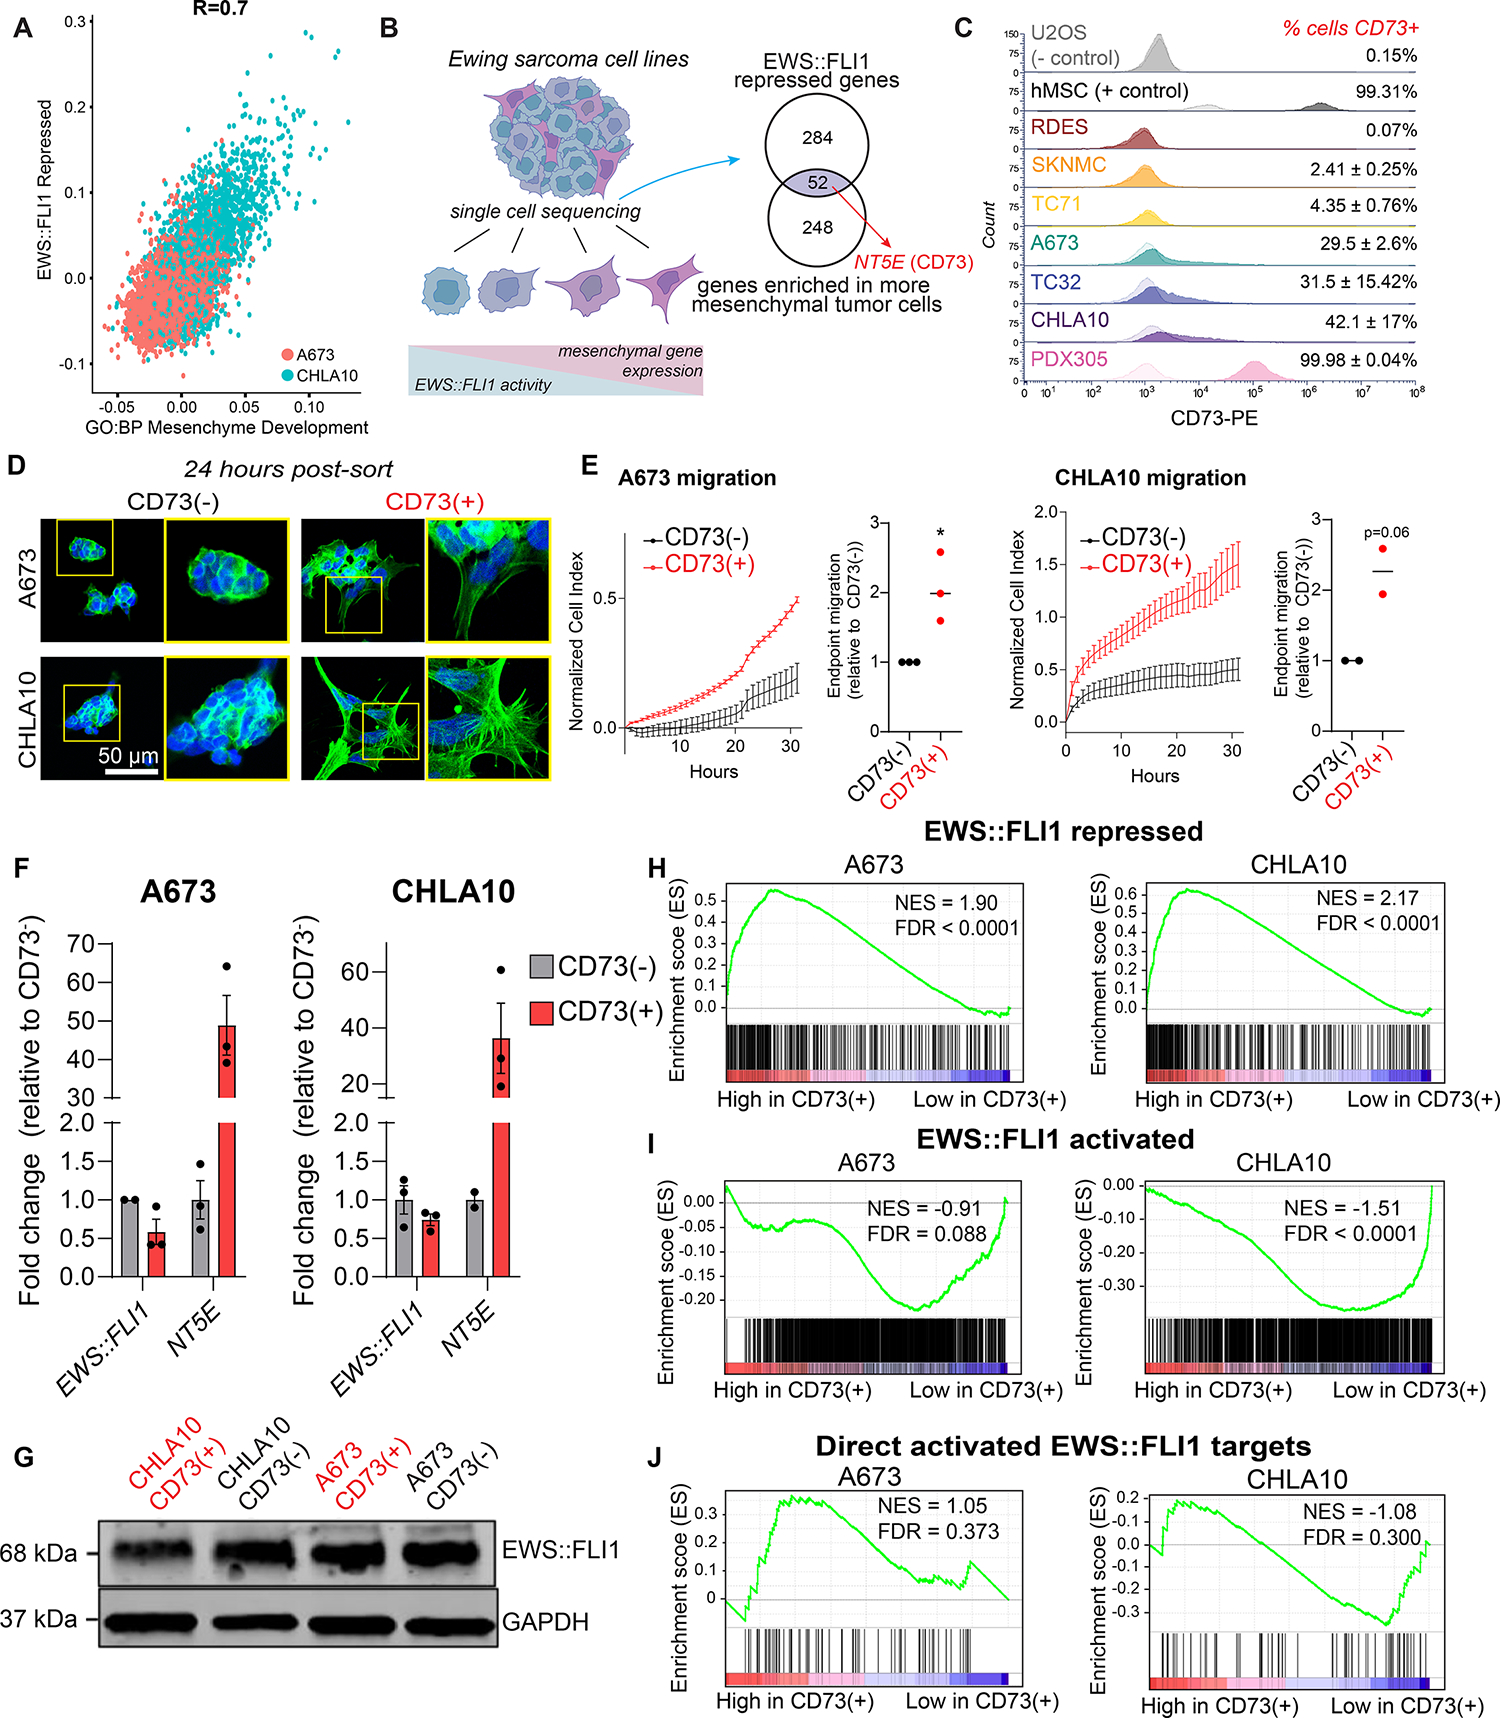
Figure 1. CD73 marks mesenchymal tumor cells that express EWS::FLI1-repressed genes.

A) Scatter plot depicting expression of an EWS::FLI1 repressed gene set (31) and mesenchyme development genes (GO:0060485) in A673 and CHLA10 single-cell sequencing data (19). B) Left, Ewing sarcoma cells exist along a spectrum of mesenchymal identity. Genes associated with mesenchymal identity are repressed by EWS::FLI1. Right, Venn diagram depicting genes enriched in mesenchymal state EwS cells that are in both GO:BP Mesenchyme Development and EWS::FLI1-repressed (Kinsey et al. 2006) gene sets. C) Flow cytometry of CD73 cell surface expression in EwS and non-EwS (U2OS, hMSC) cell lines (CD73 = dark, isotype control = light). D) DAPI and F-actin staining of FACS-sorted CD73− and CD73+ EwS cells in 2D culture, 24 hours after sorting (representative images of n=3). E) Left, real-time transwell cell migration assay of isogenic CD73− and CD73+ cells (representative biological replicate shown, see Supplemental Figure 1 for additional replicates, error bars=SEM). Right, relative quantification of migration at endpoint for each replicate (A673 n=3, CHLA10 n=2). F) RT-qPCR of EWS::FLI1 and NT5E expression in CD73-sorted cell populations (n=2–3, error bars=SEM). G) Immunoblot of EWS::FLI1 protein expression in CD73-sorted cells. GAPDH is loading control. Representative of n=2. H-J) Gene set enrichment analysis (GSEA) of RNA-seq data generated from CD73-sorted cell populations (n=3) H) genes repressed by EWS::FLI1 expression (31), I) genes activated by EWS:FLI1 expression (31), and J) 78 genes directly bound and upregulated by EWS::FLI1 (30).
