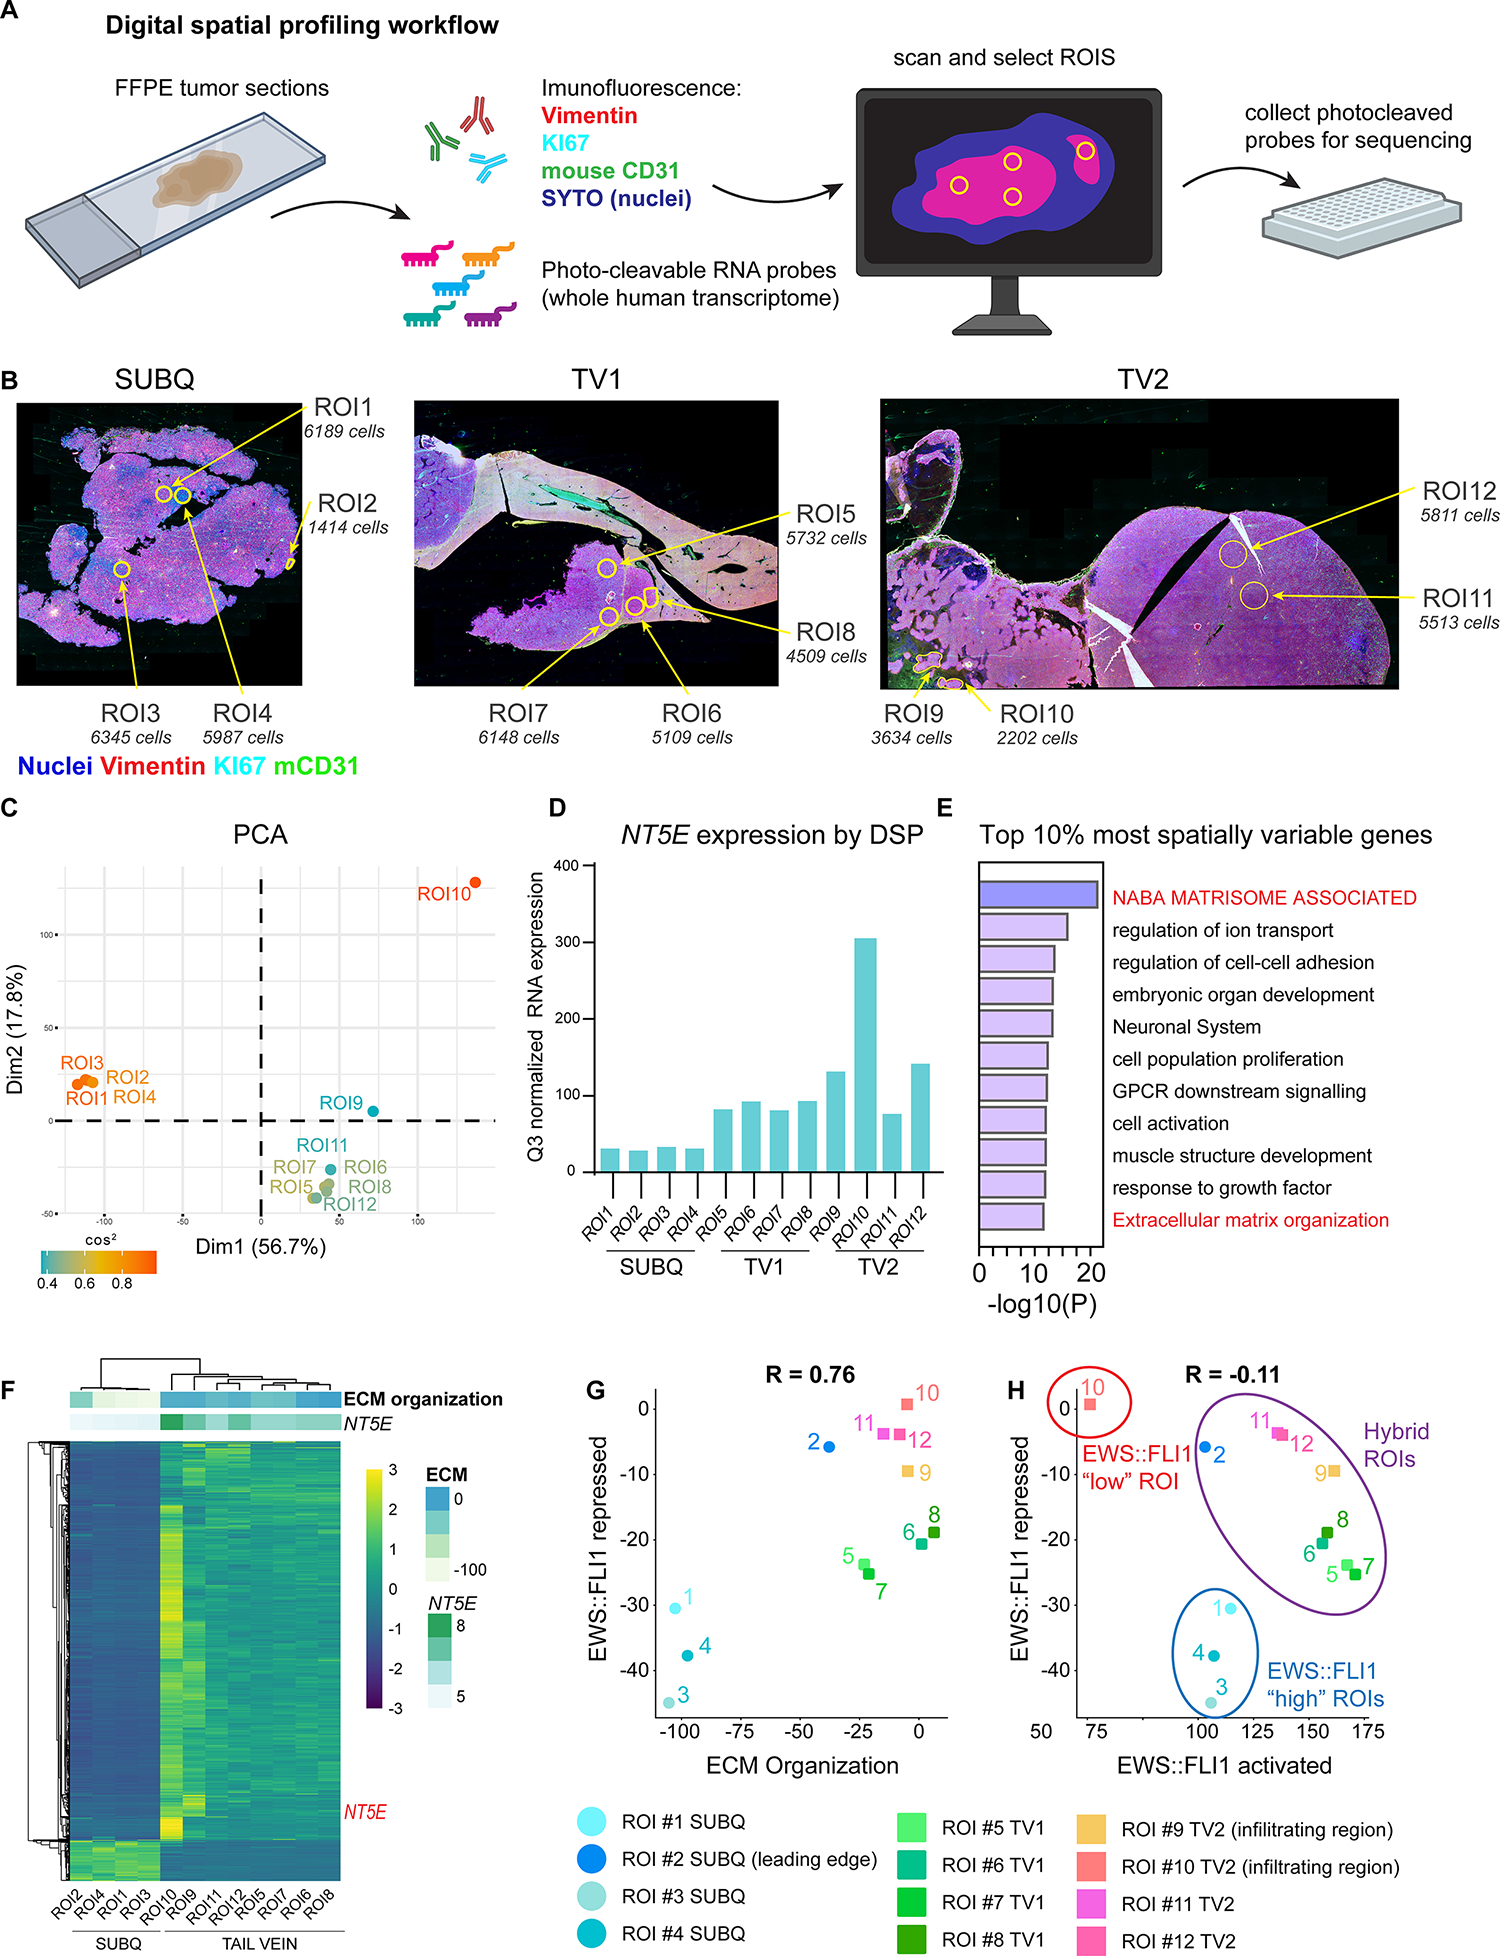
Figure 4. Digital spatial profiling reveals transcript and protein-level spatial heterogeneity in EwS tumors.

A) Workflow of the Digital Spatial Profiling (DSP) method used. Briefly, immunofluorescence of Vimentin (mesenchymal cytoskeletal marker), KI67 (proliferative nuclei), SYTO (all nuclei), anti-mouse CD31 (murine blood vessels) were used to select regions of interest (ROIs) on xenograft sections hybridized with a whole human transcriptome probe library. ROIs were captured and gene expression quantified by next-generation sequencing after UV cleavage of probes from selected ROIs. B) Vimentin, KI67, mCD31, SYTO (nuclei) immunofluorescence and selected ROIs indicated for each of 3 tumors subjected to DSP: CHLA10 (SUBQ) and tail vein-derived liver (TV1) and retroperitoneal (TV2) tumors as in Figure 3. Approximate DAPI+ cell count is listed for each ROI. C) PCA plot of normalized whole human transcriptome gene expression for each ROI. Colored by cos2 value (indicates quality of representation by the principal components). D) Bar graph depicting Q3 normalized mRNA expression of NT5E within each ROI as determined by DSP and next generation sequencing. E) Gene ontology (Metascape) of the top 10% most spatially variable genes across 12 ROIs (highest coefficient of variation between ROIs, n=1339 genes). E) Unsupervised heatmap of the top 10% most spatially variable genes across all ROIs. Top panels show expression of NT5E (log2) and the GO:BP ECM Organization gene set. G) Scatter plot of expression of EWS::FLI1-repressed gene signature (31) vs. ECM Organization gene set expression. Individual ROIs are labeled. H) Scatter plot of RNA expression of EWS::FLI1 repressed signature vs. EWS::FLI1 activated signature in each ROI (31). EWS::FLI1-high, EWS::FLI1-low, and EWS::FLI1-hybrid ROIs are indicated.
