
Figure 5. Heterogeneity of NT5E and related mesenchymal transcriptomic signatures in EwS patient tumor biopsies.
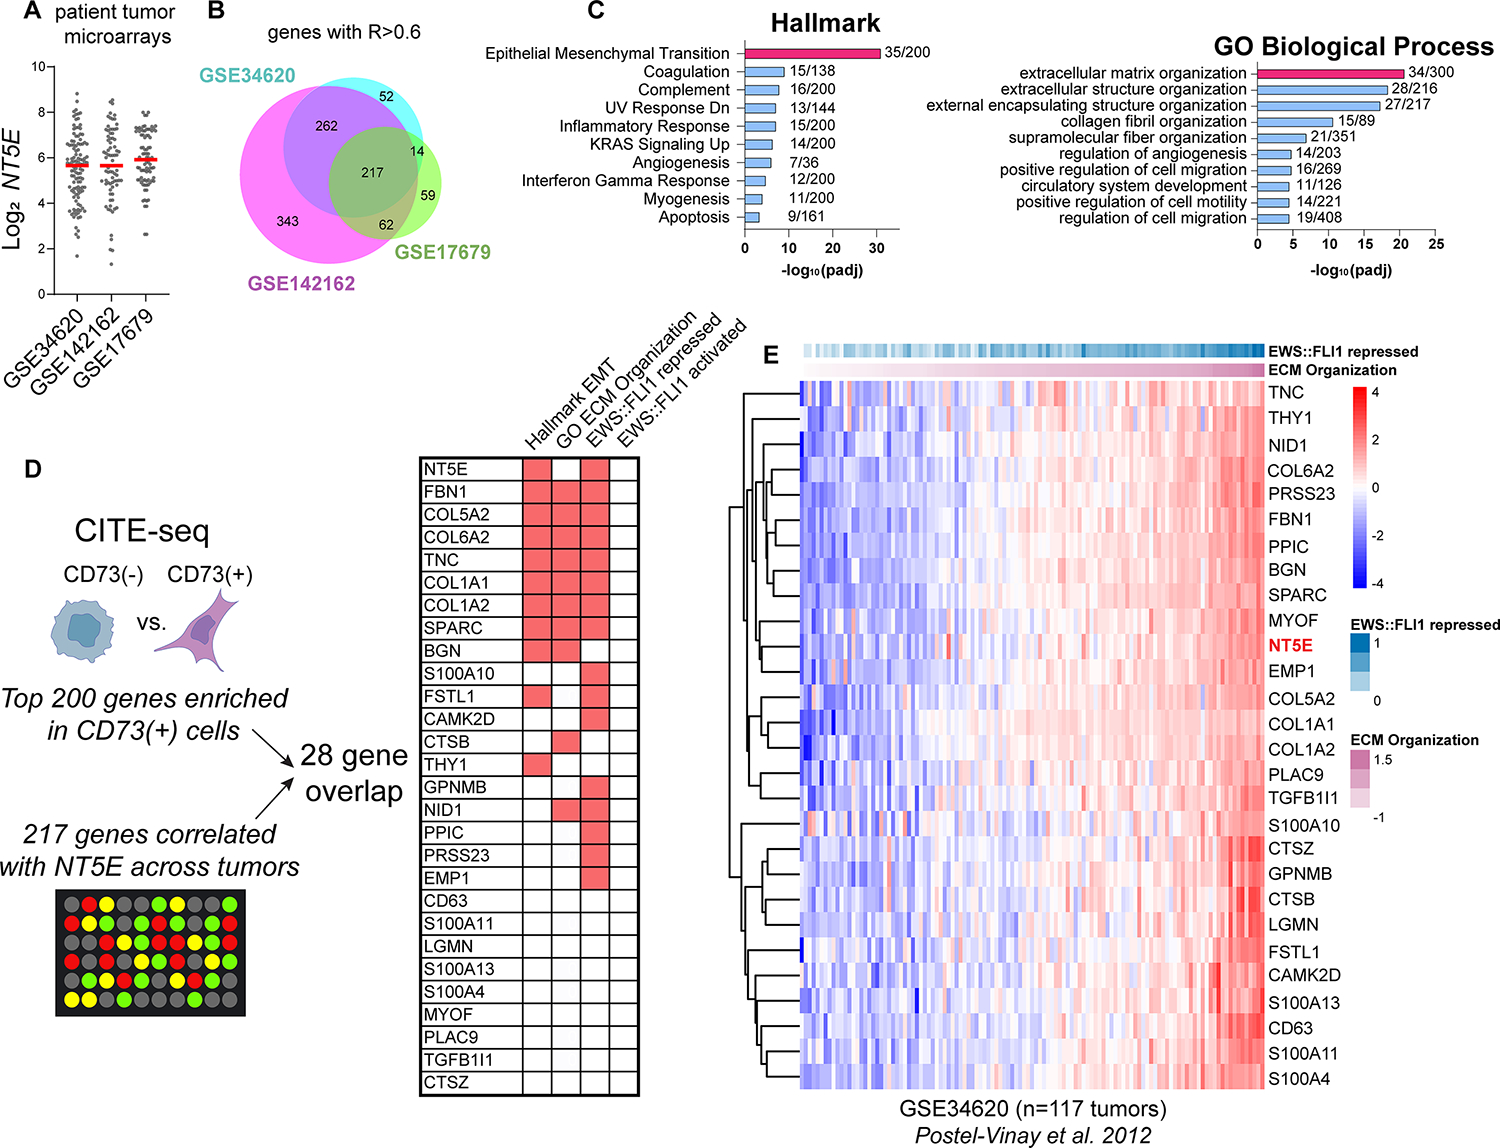
A) Log2 NT5E expression derived from three independent gene expression microarray studies of patient tumors (18, 41, 42). B) Venn diagram of genes positively correlated with NT5E (R>0.6) in each dataset and the intersection of these genes. C) Hallmark and GO:BP gene ontology (Enrichr) of the 217 NT5E-correlated genes (and NT5E itself) shared across three studies. D) Workflow and characterization of the overlap between genes marking NT5E+ cells (from Figure 2) and genes highly correlated with NT5E in patient tumor biopsies. Right, membership of overlapping 28 genes in Hallmark EMT, GO:BP ECM Organization, EWS::FLI1 repressed (31, 43, 44), and EWS::FLI1 activated gene sets (30, 31, 43, 44). E) Heatmap of NT5E and 27 associated marker gene expression vs. EWS::FLI1 repressed genes (31), ranked by ECM organization expression in Ewing sarcoma patient tumor microarray GSE34620 (41).