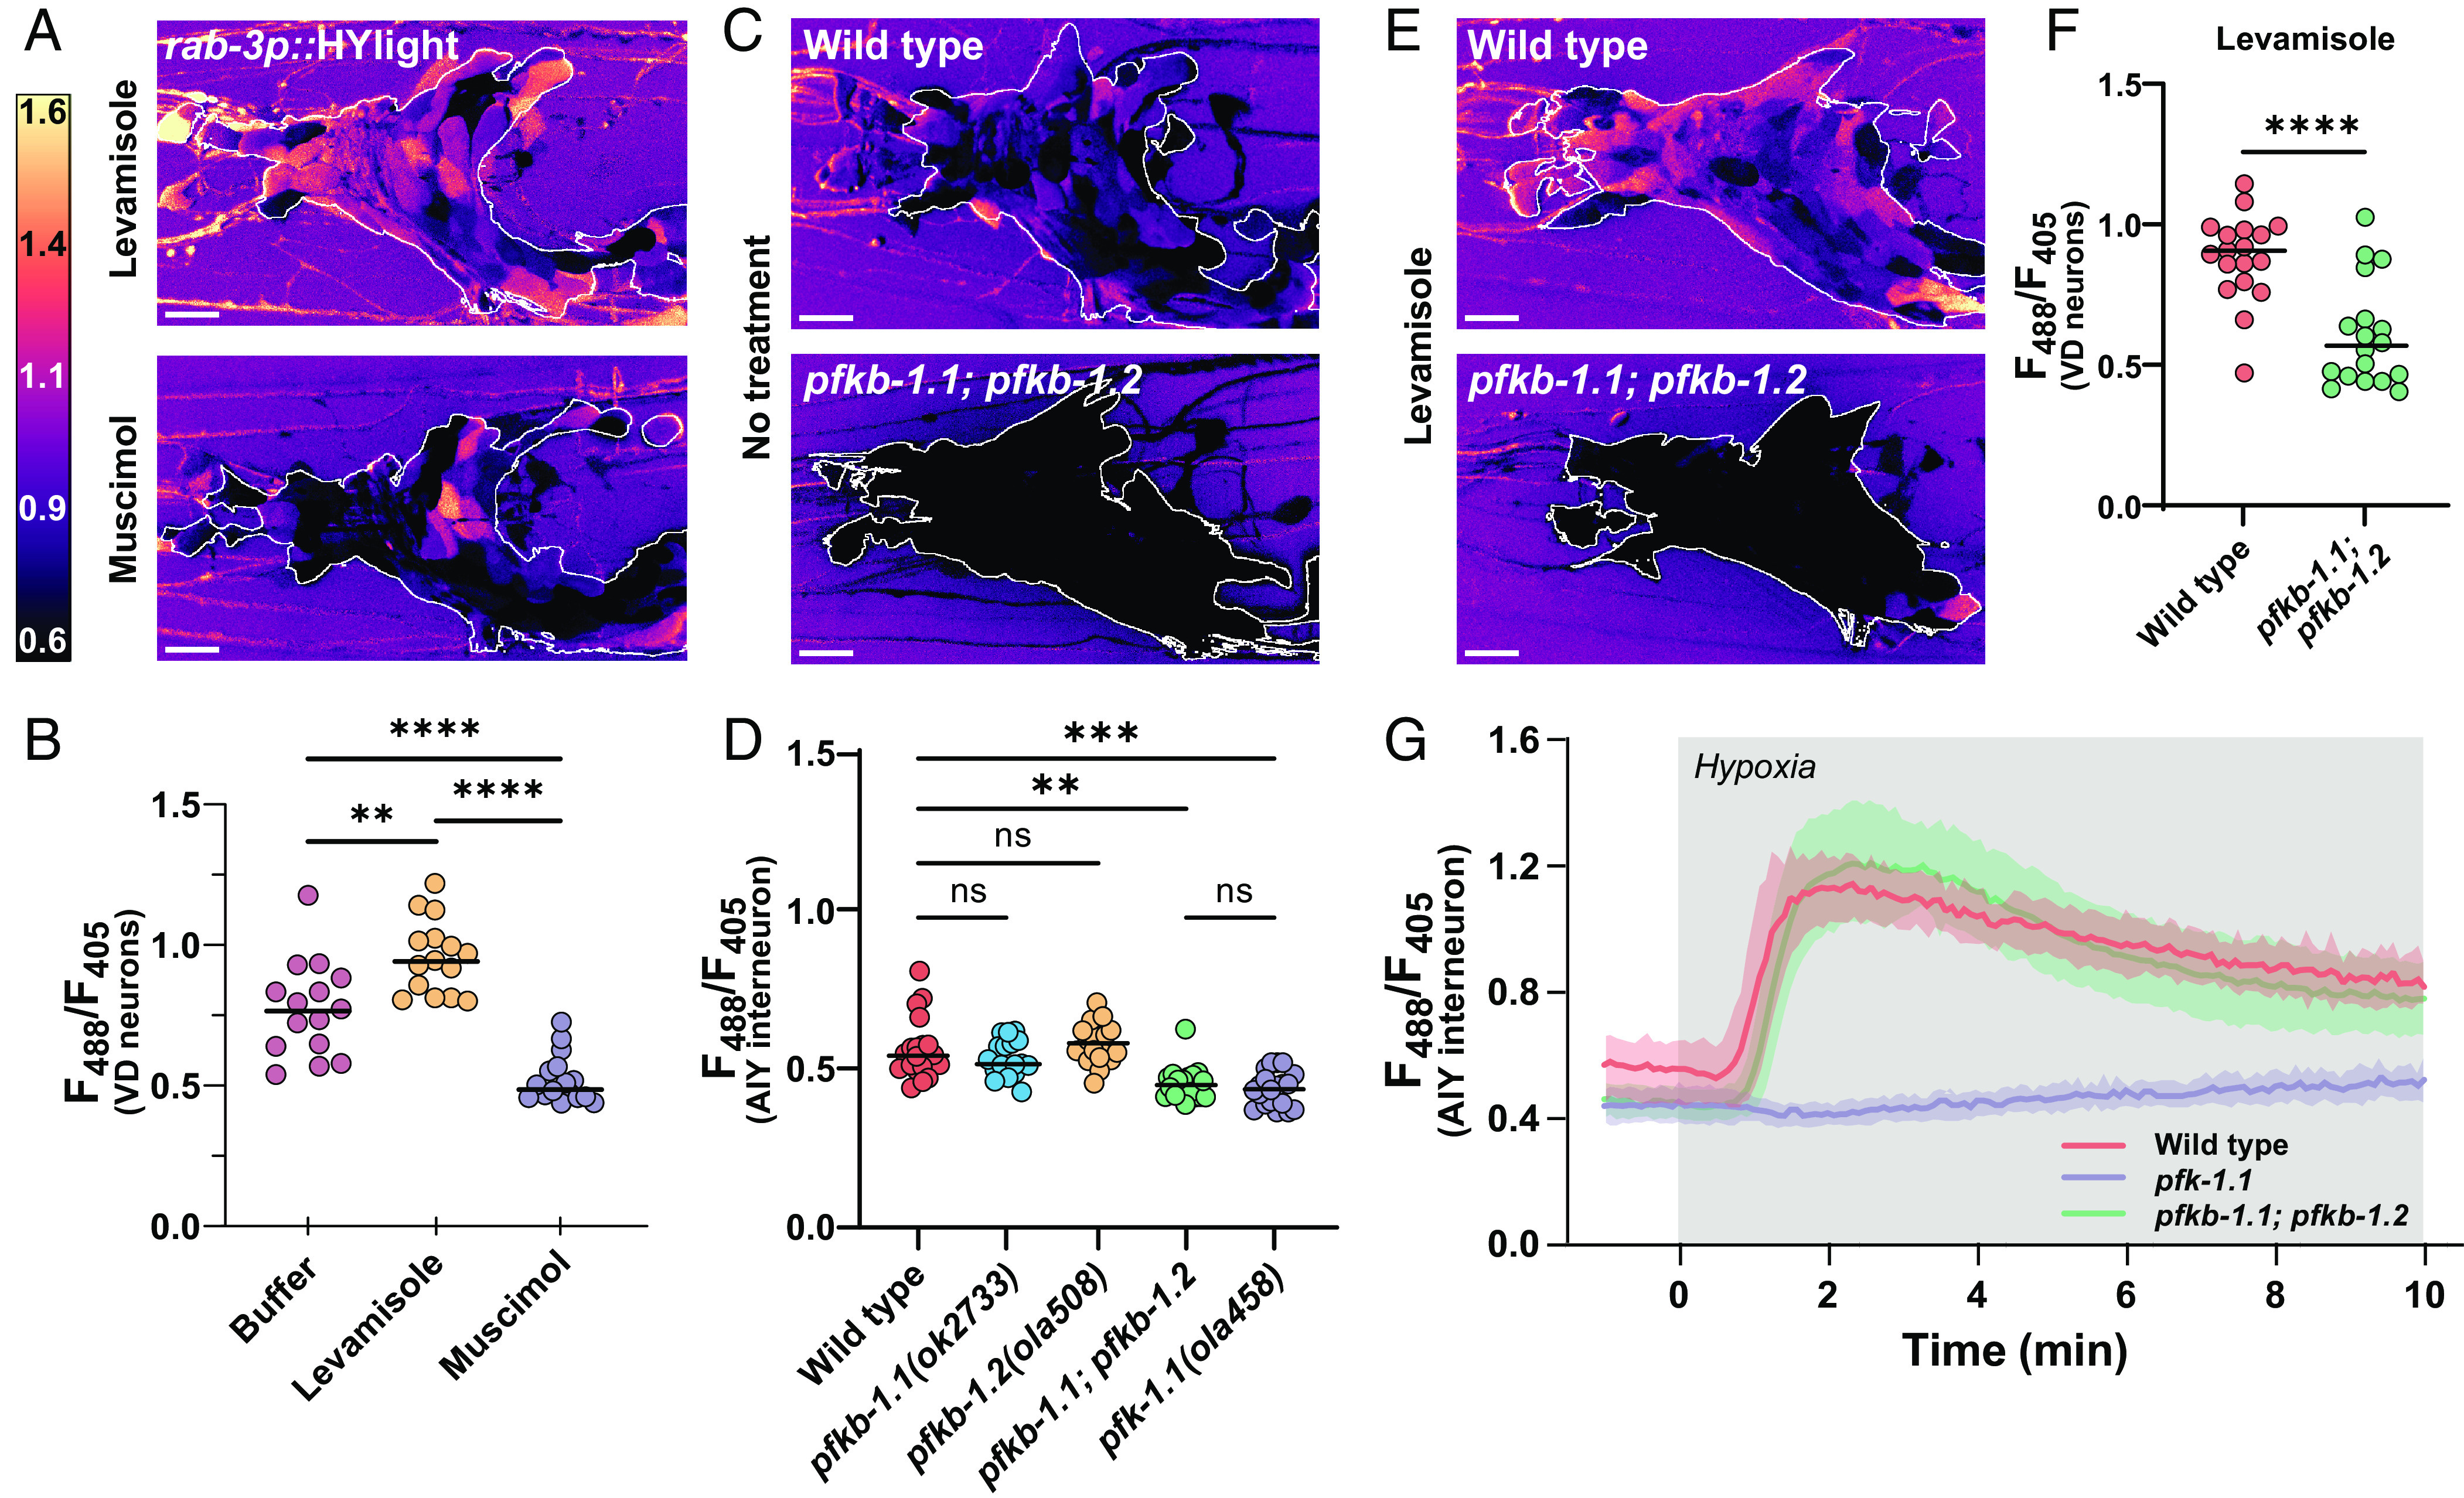
Fig. 3.

Neurons depend on PFKFB enzymes to modulate rates of glycolysis. (A) HYlight ratio of 488/405 nm excitation in the nerve ring of worms mounted in 10 mM levamisole (Top) or 50 mM muscimol (Bottom). The white outline depicts the ROI used for quantification. (Scale bar, 10 μm.) (B) Quantification of HYlight ratios in the VD neurons when worms are mounted in either M9 buffer, 10 mM levamisole, or 50 mM muscimol. Significance represents P values of 0.0013 (**) or <0.0001 (****), as calculated by ANOVA with Tukey post hoc test, for 15 animals. (C) HYlight ratios in the nerve ring of wild type (Top) or pfkb-1.1(ok2733); pfkb-1.2(ola508) double mutants (Bottom) mounted in M9 buffer. The quantified ROI is indicated by the white outline. Images of the single-mutant strains and quantification shown in SI Appendix, Fig. S3. (D) Quantification of HYlight responses for indicated genotypes in the AIY interneuron. Significance represents P values of 0.512 (WT vs. pfkb-1.1), >0.999 (WT vs. pfkb-1.2), 0.927 (WT vs. pfkb-1.1; pfkb-1.2), or <0.0001 (**), as calculated with ANOVA/Tukey post hoc test across 18 animals. (E) HYlight ratio in the nerve ring of wild-type and pfkb-1.1(ok2733); pfkb-1.2(ola508) double mutant animals exposed to 10 mM levamisole. The region used for quantification is indicated by the white outline. (F) HYlight ratios quantified for indicated genotypes in VD motor neurons in the presence of 10 mM levamisole. A P value of <0.0001 (****) is shown as calculated by the unpaired t test across 18 animals. (G) HYlight responses in the AIY interneuron for the indicated genotypes under transient hypoxia. The pfk-1.1(ola458) mutant animals do not increase upon hypoxia, whereas pfkb-1.1(ok2733); pfkb-1.2(ola508) double mutant animals, which start at a similar mean ratio as shown in (D), display responses to transient hypoxia that are indistinguishable from wild type. Shading represents the SD around mean values for 18 worms per treatment. Timing of hypoxia treatment represented by gray box. Significance of hypoxia response is shown in SI Appendix, Fig. S3.
