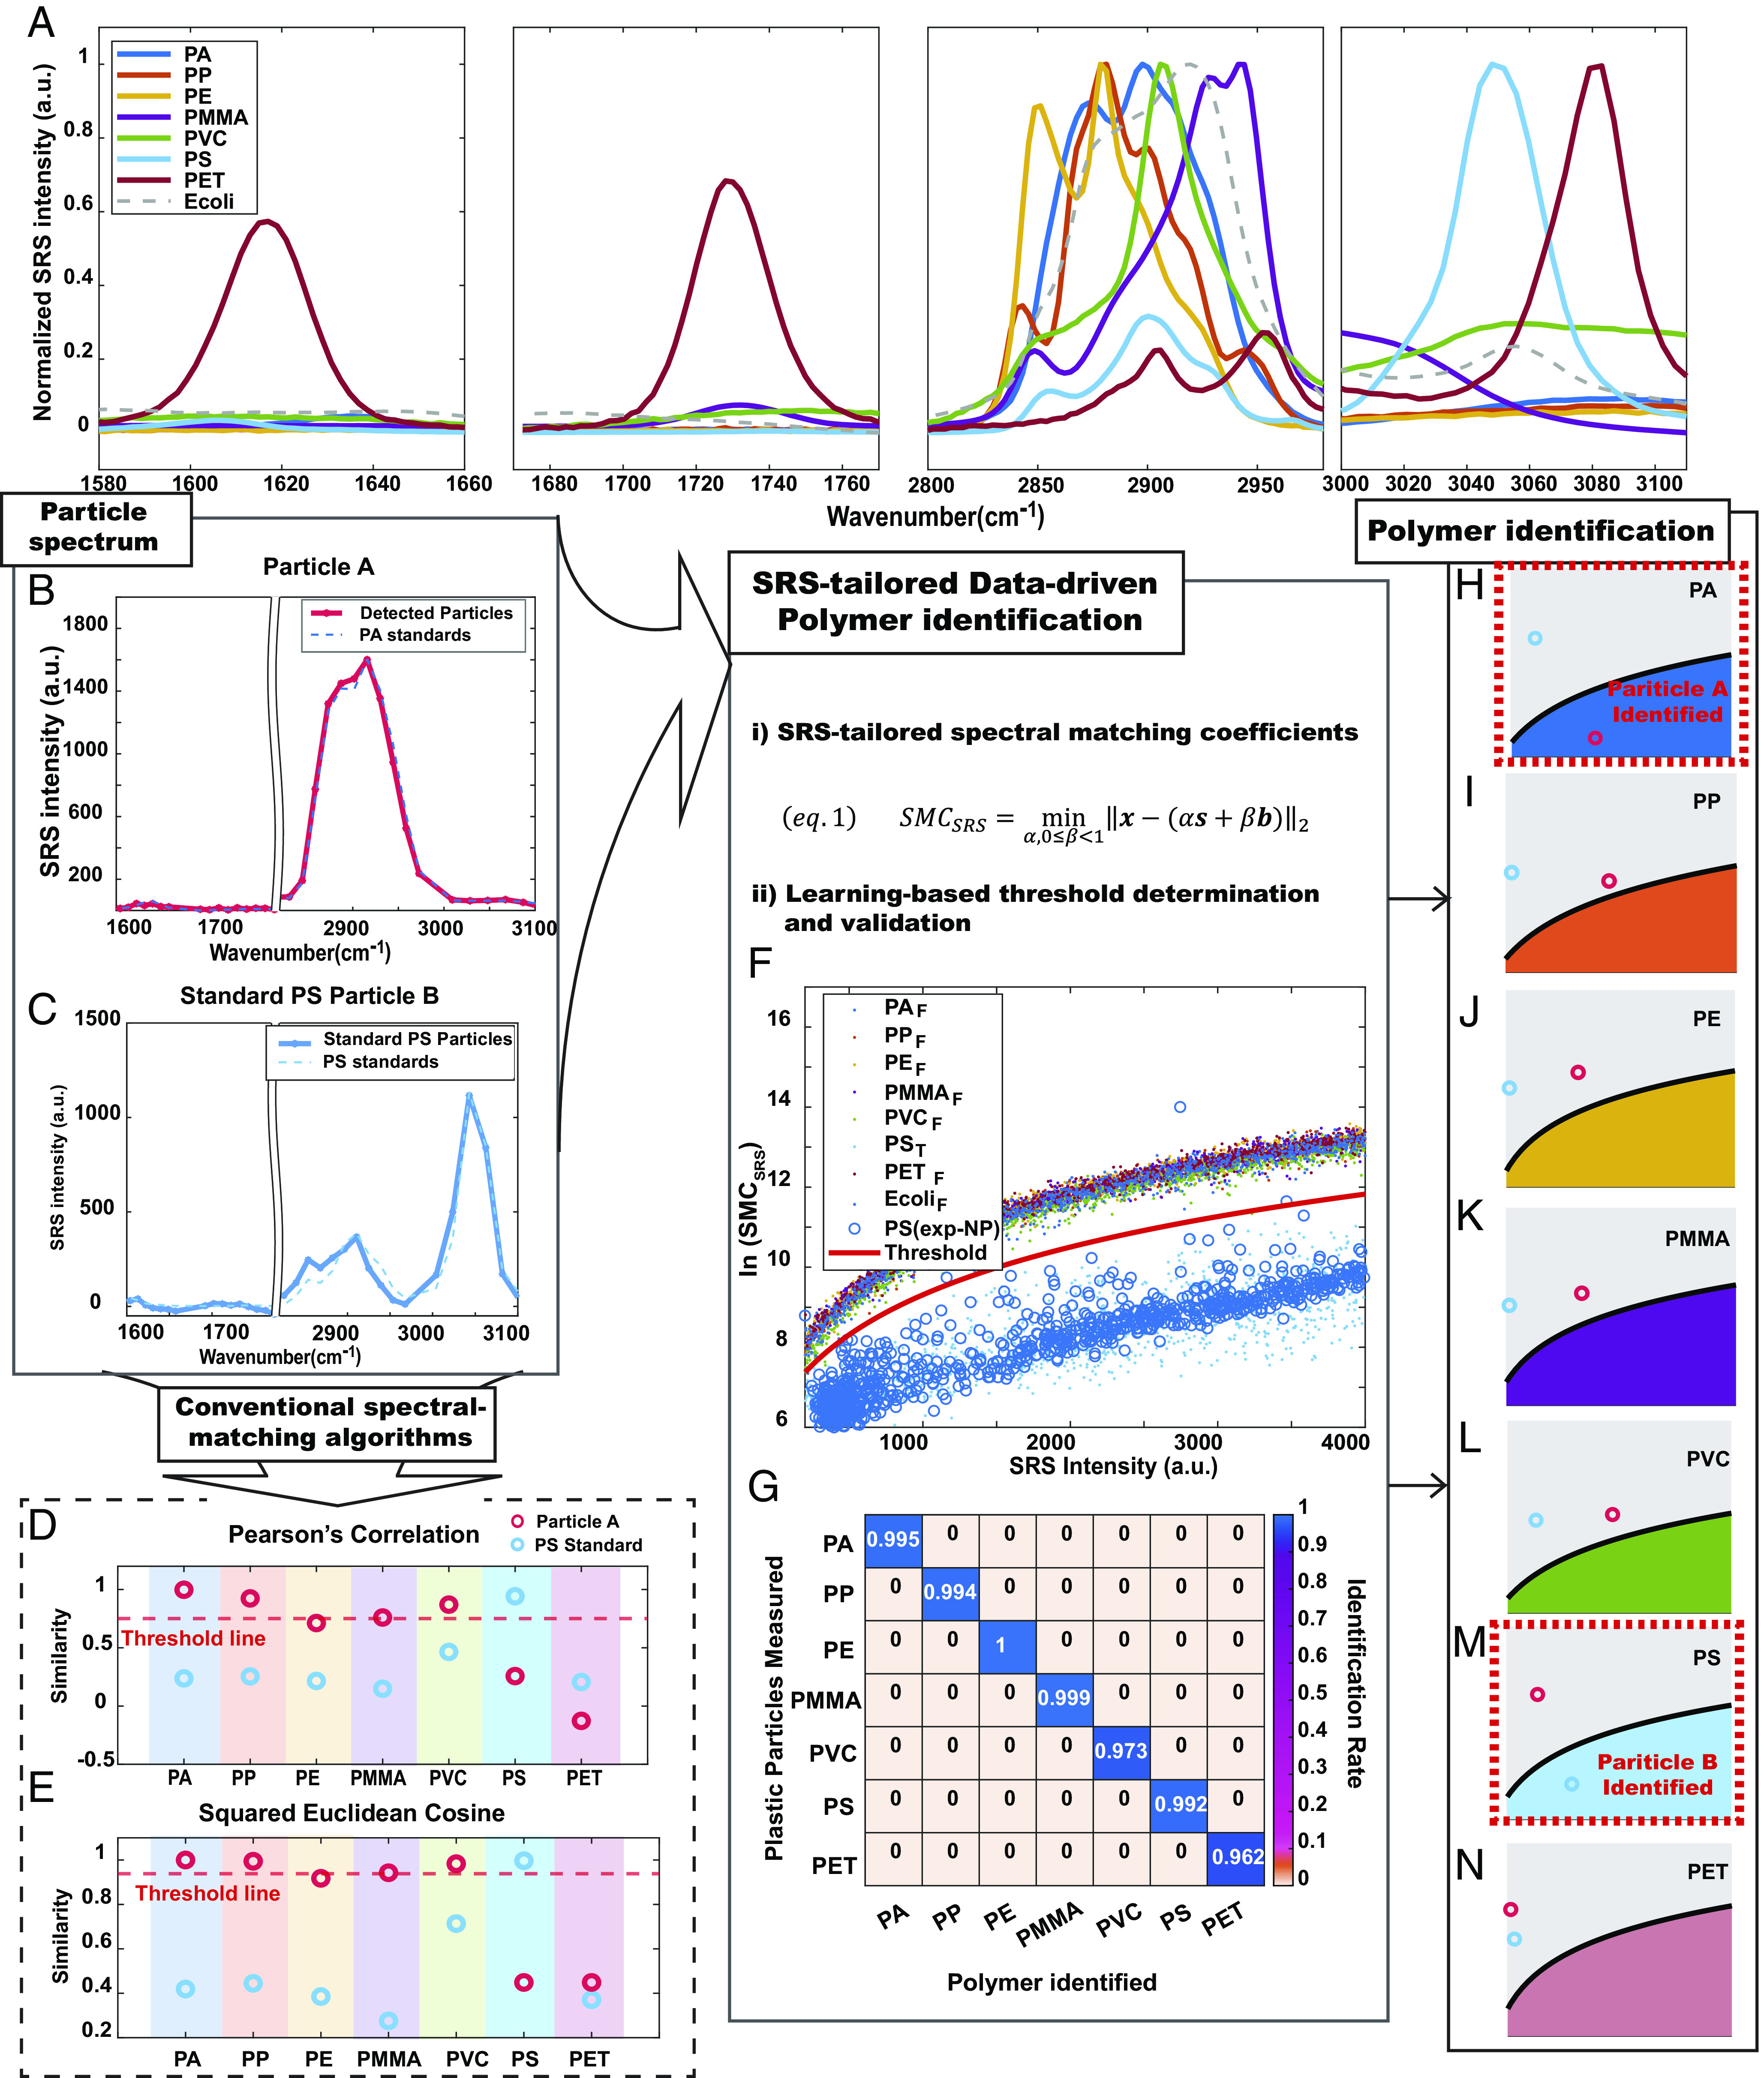
Fig. 2.

Recovering the chemical specificity for polymer identification with SRS-tailored data-driven spectral matching algorithms. (A) Normalized SRS spectra of plastic standards (PA, PE, PET, PMMA, PP, PS, and PVC) and a nonplastic standard (E. coli). (B and C) Examples of particle spectra: (B) particle A: PA microparticle (C) particle B: standard PS nanosphere. (D and E) Similarity quantification results for particles A and B from conventional spectral-matching algorithms: (D) Pearson’s correlation coefficients and (E) Squared Euclidean Cosine (SEC). The red dashed line indicates the threshold condition with 95% identification rate from the standard PS nanospheres. The same threshold condition creates elusive identification for particle A. (F) The learning process is indicated by the scatter plot of ln(SMCSRS) against SRS intensity α obtained from Eq. 1. Solid data points are from the synthetic dataset based on standards. The blue circular data points are experimental data from hyperspectral SRS imaging of PS nanospheres of three different sizes, which well colocalize with the points from the synthetic PS spectrum (light blue) with good separation from synthetic data from other chemical compositions (solid data points in other colors). The red solid line indicates the threshold line drawn for plastic polymer identification. (G) Confusion matrix for threshold condition evaluation based on experimental plastic particle measurement (H–N). Polymer identification results of the example particle A and particle B using SRS-tailored data-driven spectral matching algorithms. In each image of (H–N), the black line is the determined threshold from the learning process. The light blue circle from standard PS particle B is confirmed perfectly only with the PS matching scheme having the SMCSRS value below the threshold line (Fig. 2M). The red circle from unknown particle A is unambiguously identified to be PA with only the PA matching scheme having the SMCSRS value below the threshold line (Fig. 2H).
