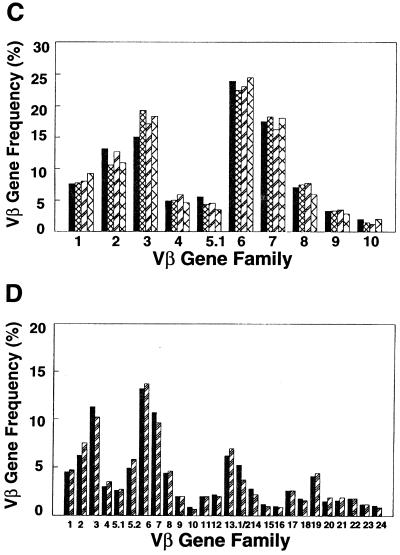
FIG. 2.
Accuracy and consistency of quantitative PCR. (A) Actual gel of PHA-activated PBL showing the resolution of the individual amplified Vβ products, as well as a coamplified Cα product to control for any variability in aliquoting of reagents or thermocycling of individual tubes (arrows). (B) Graph showing the computed Vβ percentages for PBL stimulated either with PHA for 42 h (black bars) or with SEB for 5 days (hatched bars). Note the SEB-induced increased expression of Vβ3, Vβ6, Vβ14, Vβ17, Vβ19, and Vβ22. (C and D) cDNA from the same sample of PBL was amplified at monthly intervals. Each bar pattern represents a different monthly time point. Shown are results of PCR with 10 different Vβ primers (C) and with the entire panel of 26 Vβ primers (D). The differences in Vβ percentages for the same Vβ between panels C and D result from normalization to only 10 Vβ (C) versus 26 Vβ (D).


