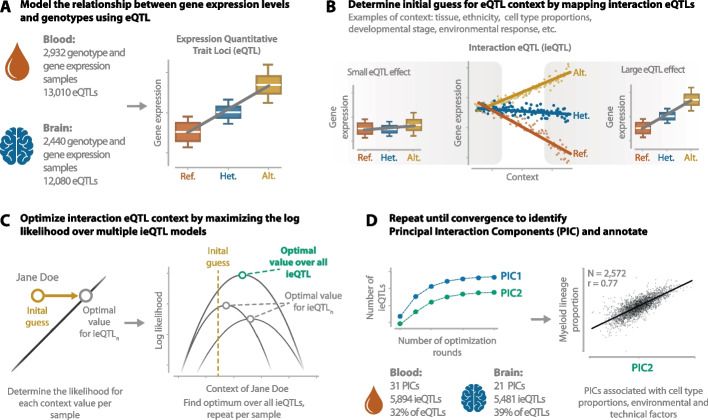
Fig. 1.
Graphical overview of the PICALO method. A PICALO takes eQTL data (i.e., gene expression and genotype dosage values) as input. B Map interactions with a starting position representing an initial guess of biological/technical context. C The starting position is optimized by maximizing the joint log-likelihood on a per-sample basis over multiple ieQTLs. D Mapping of the interactions and the subsequent optimization are repeated until convergence. The influence of the resulting principal interacting component (PIC) is regressed out from the gene expression data, and the process is repeated until no additional PICs and ieQTLs are identified. The resulting PICs capture technical and biological contexts such as cell type proportions. The illustrations shown in A, B and C are generated using dummy data

