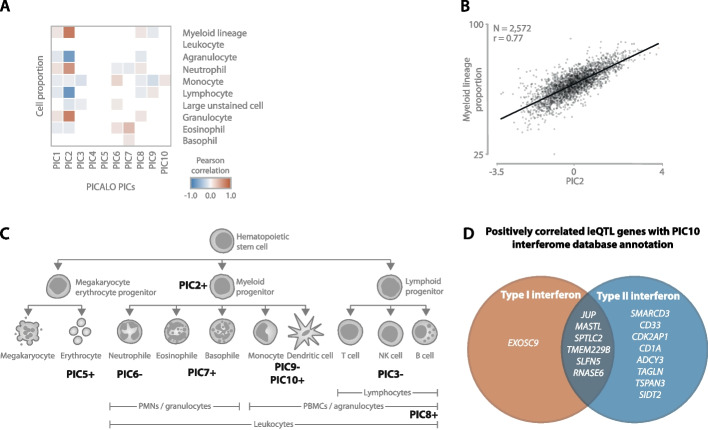
Fig. 3.
A Pearson correlation heatmap correlating PICs to measured cell type proportions in the blood. The correlation p-values are corrected for multiple testing with Benjamini-Hochberg, and only correlations with an FDR < 0.05 are shown. B Regression plot showing the correlation between PIC2 and myeloid lineage cell proportions (granulocyte + monocyte) in the blood. C Simplified overview of the blood cell type lineage with annotations of PICs describing distinct (groups of) cell types using measured cell type proportions, gene set enrichments, and single-cell expression enrichment. Positive and negative signs indicate the direction of the effect. Only the first 10 PICs are considered. An image of the top layer cell type is created with BioRender.com. D Negatively correlating eQTL genes interacting with PIC10 showed enrichment for type II interferon signaling as annotated by the Interferome Database Annotation

