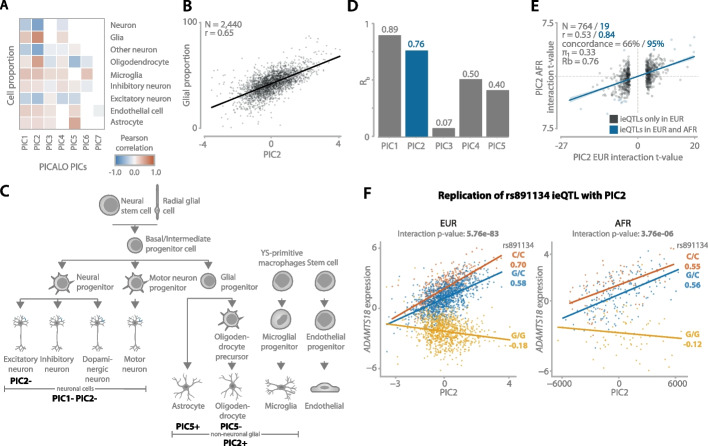
Fig. 4.
A Pearson correlation heatmap correlating PICs to predicted cell type proportions in the brain. The correlation p-values are corrected for multiple testing with Benjamini-Hochberg, and only correlations with an FDR < 0.05 are shown. B Regression plot showing the correlation between PIC2 and glial proportion (microglia + oligodendrocyte + astrocyte) in the brain. C Simplified overview of the brain cell type lineage with annotations of PICs describing distinct (groups of) cell types using predicted cell type proportions, gene set enrichments, and single-nucleus expression enrichment and replication. Positive and negative signs indicate the direction of the effect. Only the first seven PICs are considered. Images of the bottom layer cell types are created with BioRender.com. D Rb replication statistics for the replication of eQTLs interacting with the first five PICs discovered in samples of European ancestry (EUR) and replicated in samples of African ancestry (AFR). E Regression plot showing the interaction t-values of PIC2 ieQTLs discovered in EUR and replicated in AFR. Blue points are significant in both datasets, the statistics of which are shown in blue. The shaded area indicates the 95% confidence interval. F Example of replicating ieQTL: rs891134 affecting ADAMTS18 gene expression and interacting with PIC2. The left plot shows the interaction in EUR, and the right plot shows AFR. The x-axis shows the PIC2 scores, the y-axis shows the covariate corrected gene expression, and each dot represents a sample. The p-values are calculated using the unconditional ieQTL analysis. Colors indicate SNP genotype. Values under the alleles are Pearson correlation coefficients

