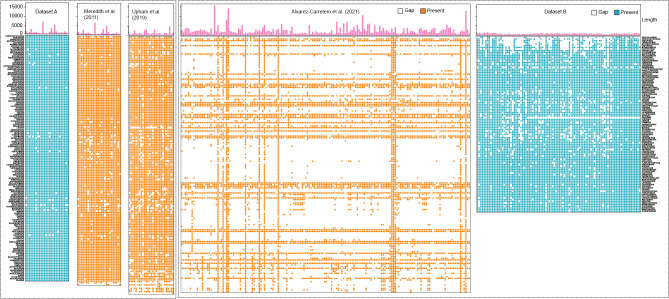
Figure 1.
Comparison of datasets between this and previous studies
Top panel is length of gene fragments corresponding to each column in bottom panel. Left and right annotations are family name (ordered by phylogenetic relationships). Left four panels follow left family name annotation and right panels follow right family name annotation. Gap information of gene fragments from Dataset A, Meredith et al. (2011), Upham et al. (2019), Álvarez-Carretero et al. (2022), and Dataset B. Blue and yellow indicate present gene fragments in this and other studies, respectively, white indicates missing gene fragments.

