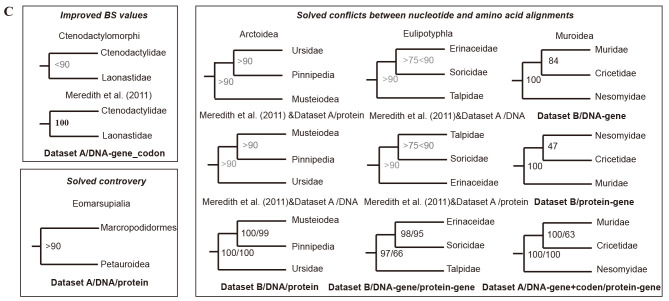
Figure 2.
Phylogenetic trees and estimated divergence times of extant mammalian families
A: Phylogenetic timetree of 162 mammals, rooted with five vertebrate outgroups (chicken, zebra finch, green anole, frog, and zebrafish) generated with Dataset A. B: Phylogenetic timetree of 120 mammals, rooted with one Monotremata outgroup (platypus) generated with Dataset B. All nodes were strongly supported (BS≥90% and Bayesian posterior probabilities (BPP)≥0.95) except for nodes denoted by solid blue circles (consistent between DNA and amino acid trees, with BS≥70<90, BPP≥0.90) or solid red circles (conflict between DNA and amino acid trees under different partitioning strategies). Strongly supported nodes showing disagreement between the two datasets are indicated with solid black circles. Fossil calibration points are tagged with bone cartoon icons. Dashed line corresponds to KPg boundary. Long branches are truncated with double slashes. C: Improved phylogenetic relationships among families compared to previous studies or different datasets with consistent topology. Meredith et al. (2011) & Dataset A/protein mean topologies between Meredith et al. (2011) and Dataset A/protein are consistent, and BS values sourced from the Dataset A/protein.

