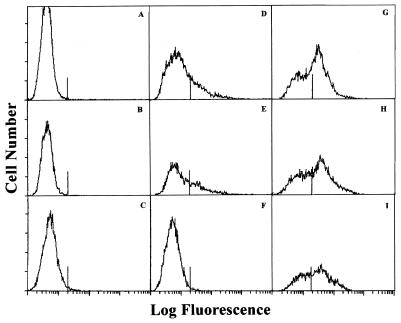
FIG. 5.
Flow cytometry analysis of live T. foetus cells indicates differences in expression levels of Tf190 and Tf190 epitopes among isolates of T. foetus. T. foetus isolates 330.1 (A, D, and G), Y-32 (B, E, and H), and BQM (C, F, and I) were probed with fluorescein-conjugated anti-mouse IgG (A to C), 32.3B3.5 plus fluorescein-conjugated anti-mouse IgG (D to F), or rabbit anti-Tf190 plus fluorescein-conjugated anti-rabbit IgG (G to I). The vertical line on each x axis indicates the 1.9 × 101 intensity that 95% or more of control cells (parasites plus conjugate) fell below. Data in each panel are based on an analysis of 10,000 events.

