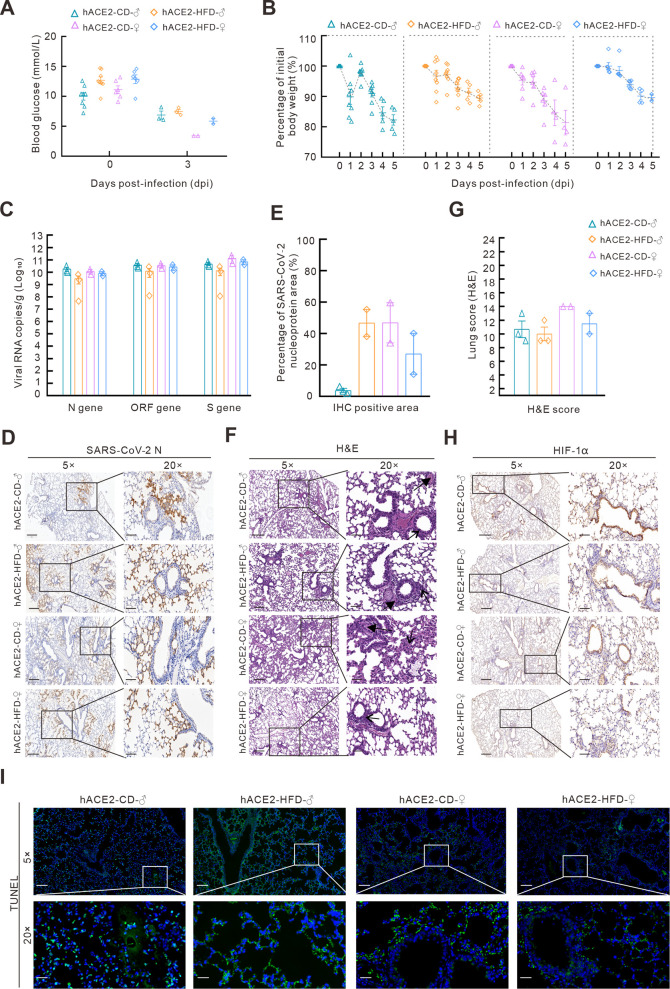
Figure 1.
hACE2-transgenic mice are sensitive to SARS-CoV-2 infection under both CD and HFD
A, B: Blood glucose levels (A) and body weight changes (B) in hACE2-transgenic mice (hACE2Tg) fed CD or HFD after SARS-CoV-2 infection. C: SARS-CoV-2 N, ORF1ab, and S genes were detected using qPCR in the lungs of hACE2-CD and hACE2-HFD mice after infection. D: SARS-CoV-2 N proteins in the lungs were detected using IHC. 5×, scale bar represents 400 µm; 20×, scale bar represents 100 µm. E: SARS-CoV-2 N protein-positive area was calculated using Case Viewer. F: Histopathological changes associated with SARS-CoV-2 infection in lung tissues of hACE2-CD and hACE2-HFD mice detected using H&E staining (arrow indicates inflammatory cell infiltration, bold arrow indicates hyaline membrane). 5×, scale bar represents 200 µm; 20×, scale bar represents 50 µm. G: Lung scores were counted according to INHAND standard rules. H: HIF-1α expression in lungs of hACE2-CD and hACE2-HFD mice after infection was detected using IHC. I: TUNEL immunofluorescence staining of lungs in hACE2-CD and hACE2-HFD mice. H, I: Shown at 5×, scale bar represents 300 µm; 20×, scale bar represents 100 µm.

