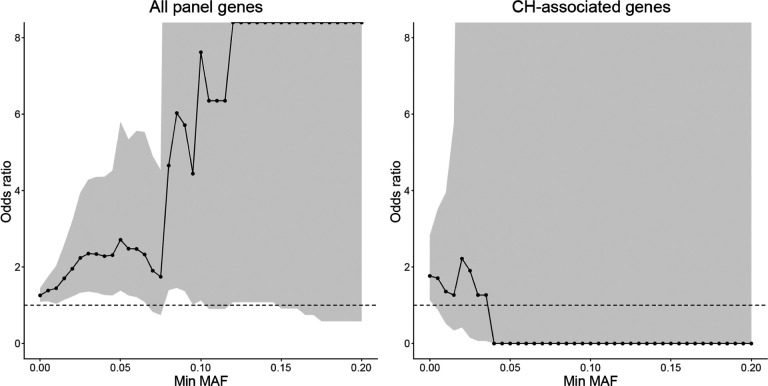
Extended Data Fig. 7. The odds ratio of AD enrichment for sSNVs with different MAF cutoffs.
When we consider all the 149 genes targeted by the panel sequencing, we observe a consistent trend of AD enrichment even for sSNVs with 5% or more MAF. In comparison, when we only consider deleterious somatic mutations in CH-associated genes, the odds ratio becomes smaller than 1 when MAF is larger than 4% though with a very large confidence interval. The dashed line represents the odds ratio of 1, and odds ratios larger and smaller than 1 denote the enrichment and depletion of sSNV in AD, respectively.

