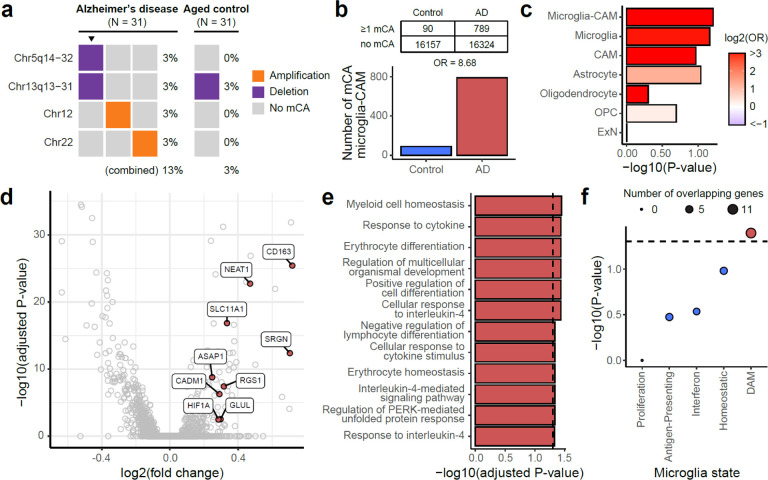
Fig. 5. mCAs in AD microglia are associated with a pro-inflammatory, disease-related signature.
a, Microglia from AD brains contain nominally more mCAs associated with hematopoietic overgrowth syndromes compared to age-matched controls, even in this small sample (N = 31 each). Triangles highlight an individual with multiple mCAs. b, AD brains show a trend (p = 0.06, permutation test) towards a higher fraction of mCA-carrying microglia than age-matched controls. c, Odds ratios of mCA-carrying cells between AD and control individuals across different cell types. Microglia-CAM (p = 0.06) and microglia (p = 0.07) have the smallest nominal p-values in permutation test compared to CAMs (p = 0.11), astrocytes (p = 0.09), oligodendrocytes (p = 0.50), OPC (p = 0.40), and ExN (p = 0.99). OPC, oligodendrocyte progenitor cell. ExN, excitatory neuron. d, Volcano plot shows differentially expressed genes between AD donor microglia-CAMs with and without mCA. Positive fold-change indicates upregulation in microglia-CAMs with mCA. DAM-associated upregulated genes are colored red. e, Significantly (adjusted p < 0.05, hypergeometric test) enriched gene ontology terms for genes upregulated in microglia-CAMs with mCA. f, Enrichment of microglial state modules53 among genes upregulated in microglia-CAMs with mCA. Significant enrichments implicate inflammation and the DAM transcriptional state.

