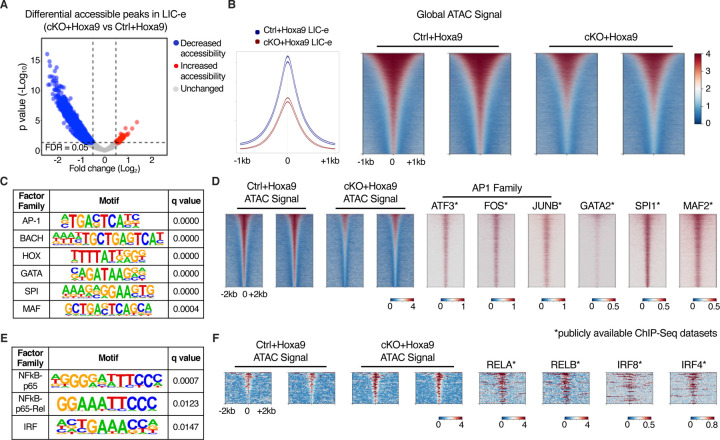
Figure 6: Effects of Phf6 loss on chromatin accessibility in LIC-e cells.
A, Volcano plot showing differentially accessible regions in LIC-e cells from cKO+Hoxa9 compared Ctrl+Hoxa9. (n = 3 biological replicates)
B, Representative signal profile (left) and metagene plots (right) showing genome-wide intensity of ATAC signal in Ctrl+Hoxa9 and cKO+Hoxa9 LIC-e cells.
C, HOMER analysis for regions of decreased chromatin accessibility in cKO+Hoxa9 LIC-e cells, showing enrichment of AP-1, HOX, GATA, SPI1, and MAF motifs.
D, Representative metagene plots at regions of decreased chromatin accessibility in cKO+Hoxa9 LIC-e, show ChIP-Seq signal for select proteins whose motifs are seen to be enriched through HOMER in (C).
E, HOMER analysis for regions of increased chromatin accessibility in cKO+Hoxa9 LIC-e cells showing enrichment of NF-kB and IRF motifs.
F, Representative metagene plots at regions of increased chromatin accessibility in cKO+Hoxa9 LIC-e, show ChIP-Seq signal for select proteins whose motifs are seen to be enriched through HOMER in (E).
Publicly available ChIP-Seq datasets in leukemia or myeloid cells were used in metagene heatmaps (Table S3). All plots were centered around ATAC-Seq peaks. SeqPlots was used to draw all metagene plots.

