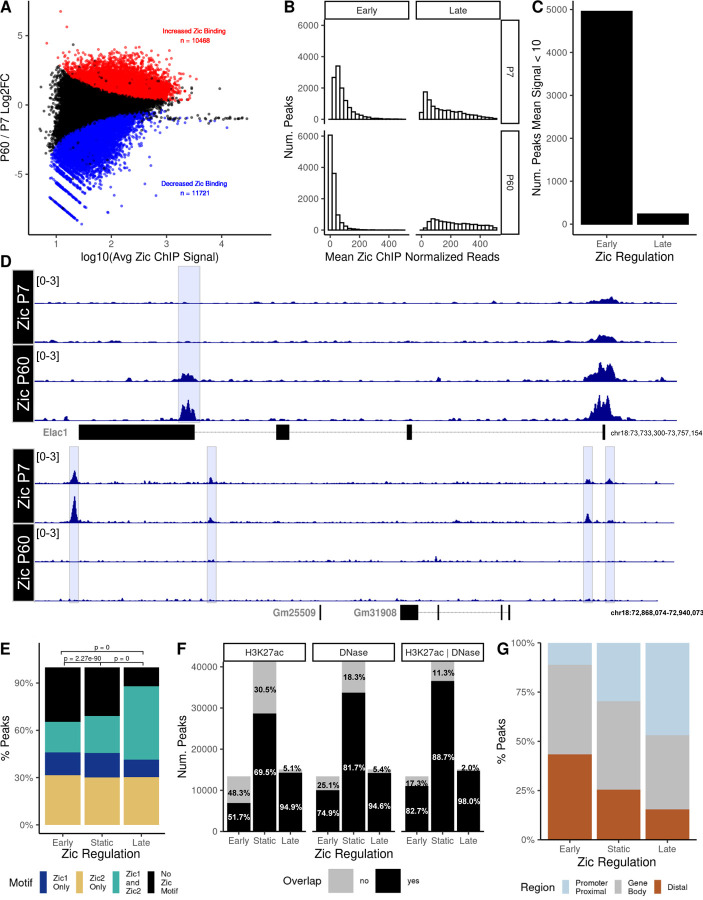
Figure 1: Zic1/2 binding is dynamic across mouse cerebellar development.
A) MA plot comparing Zic ChIP-seq peaks at P7 and P60. Red, significantly increased, blue significantly decreased (FDR < 0.05). B) Distribution of the mean normalized reads in early and late Zic ChIP peaks at P7 and P60. C) Total number of dynamic early and late Zic ChIP-seq peaks that were either completely lost as CGNs mature (Early) or newly gained between P7 and P60 (Late) as defined in the results text. D) Example tracks of peaks that were lost as CGNs mature or gained between P7 and P60. E) Proportion of Zic1 and Zic2 motifs found in the dynamic and static Zic ChIP peaks. F) Overlap (black) or nonoverlap (gray) of Zic ChIP peaks with H3K27ac peaks, DNase hypersensitive sites (DHS), or both. G) The distribution of dynamic and static Zic ChIP-seq peaks with respect to genomic features.

