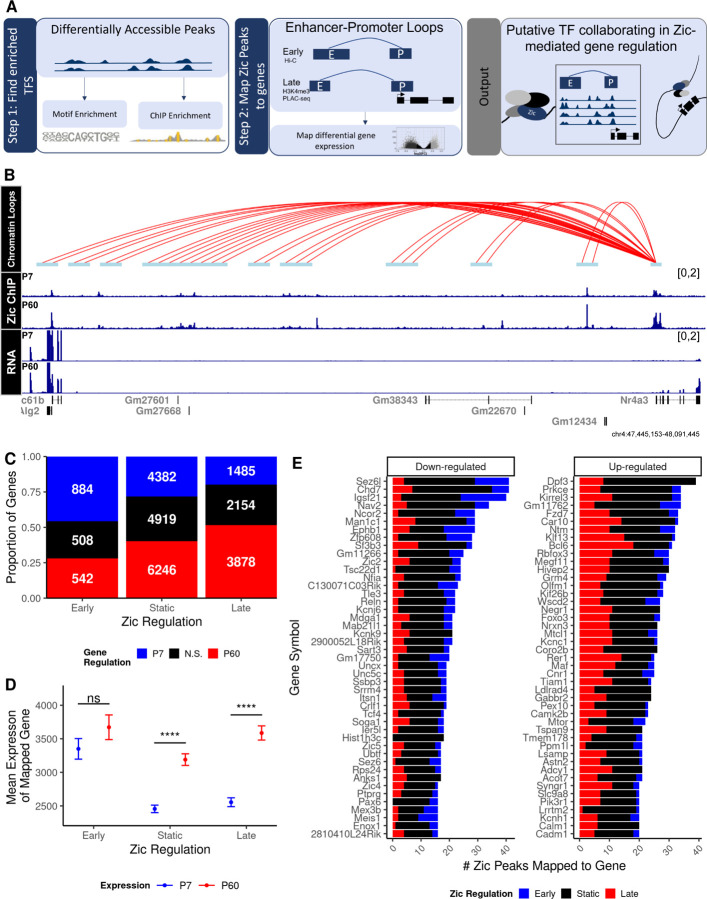
Figure 3: Zic binding sites can be mapped to genes through chromatin looping.
Zic ChIP peaks were overlapped with anchors derived from cerebellar Hi-C (28) and H3K4me3 PLAC-seq (26) data. A) Schematic of peak mapping workflow using chromatin looping data. B) Example tracks of H3k4me3 loops interacting with the Nr4a3 gene 100MB upstream, Zic ChIP-seq at P7 and P60, and RNA-seq at P7 and P60. C) Overall number of genes mapped to early, static, and late Zic ChIP-seq peaks. D) Expression of genes at P7 and P60 mapped to early, static, and late Zic ChIP-seq peaks. Graph shows mean and standard deviation of gene expression, *** denotes a significant difference in the mean expression between P7 and P60 with a Bonferroni adjusted p < 2.2e6 using a pairwise t-test. E) Top 50 down-regulated (FDR < 0.0f, LFC < 0) and up-regulated (FDR < 0.05, LFC > 0) genes by the number of mapped Zic ChIP-seq peaks that are dynamic between P7 and P60. Red indicates ChIP-seq peaks enriched at P60 (late), blue indicates enriched at P7 (early), and black indicates static peaks.

