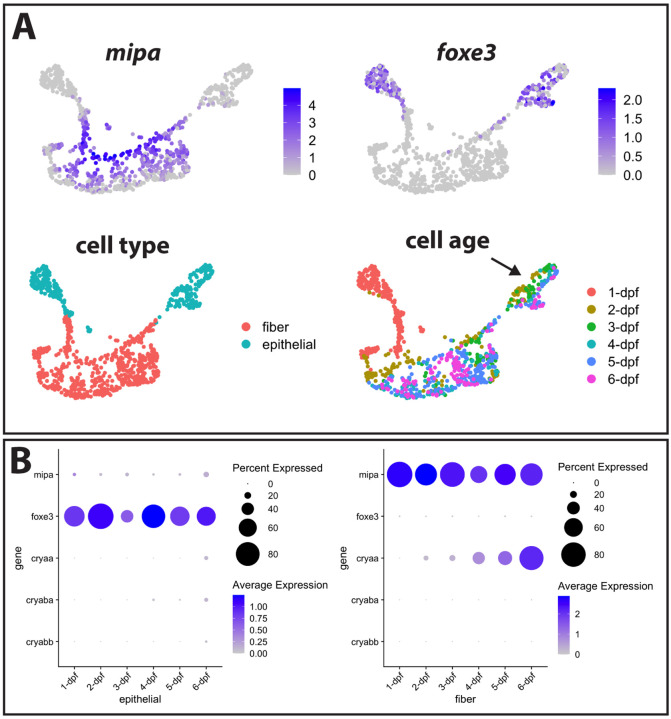
Figure 1. Single cell RNA-Seq analysis of gene expression in zebrafish lens cells through 6 dpf.
The expression of genes with known localization to lens fiber cells (mipa) and lens epithelial cells (foxe3) was used to identify the clusters containing these two cell types (A). Intensity of purple coloration indicates relative expression in each cell. Cells were also colored by age, with an arrow indicating epithelial cells showing a gradient in gene expression between 2 and 6 dpf. The expression of cell type marker genes and the three α-crystallin genes is shown in each cell type from 1 to 6 dpf (B).

