
Figure 7. Lens mRNA levels of three α-crystallin genes and the βB1-crystallin gene in wild-type, cryaa, and cryaba mutant lenses.
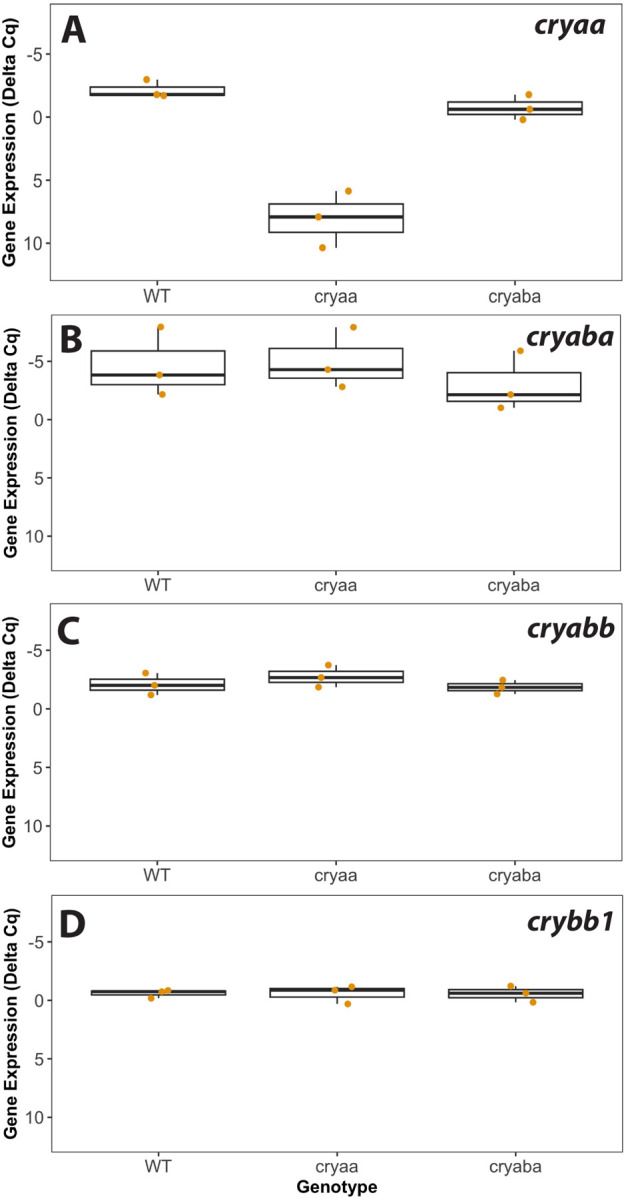
Box and whisker plots are shown for each crystallin gene, with three RT-qPCR biological replicates for each of the three genotypes. The Y-axes are inverted as they show delta Cq values that account for two endogenous control genes (rpl13a and eef1a1l1), with lower values indicating higher gene expression. Data used for this analysis are included as Supplemental Table 5.