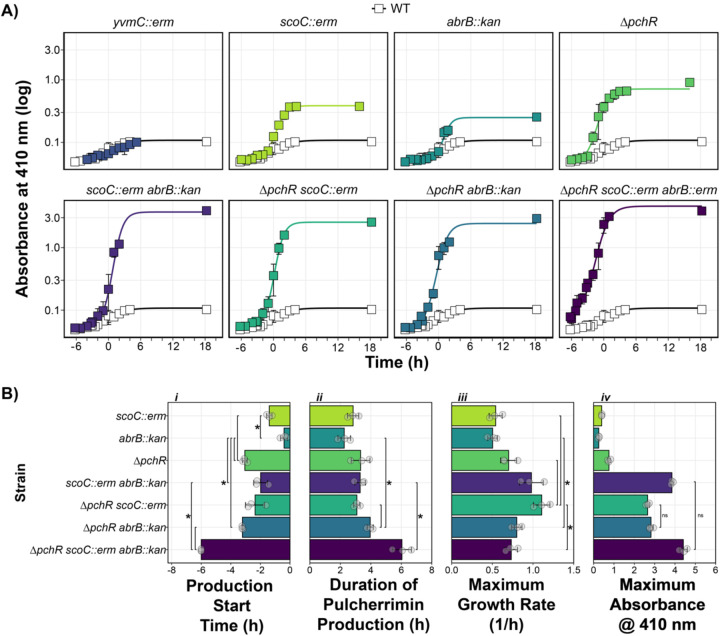
Fig. 2: ScoC, ArbB, and PchR Control Timing and Rate of Pulcherrimin Production.
A) Pulcherrimin production was measured as a function of growth phase, where T0 marks the transition from the exponential growth to stationary phase. Each panel represents the average A410 for a given strain compared to the A410 from WT (white squares). Error bars represent +/− the standard deviation. Lines running through the points are modeled using the drm function from the drc package in R (see Methods and Materials). B) Pulcherrimin production parameters as a function of genetic background: i) start of pulcherrimin production time relative to the transition phase of growth (T0), ii) the duration of pulcherrimin production, iii) the maximum estimated production rate, and iv) the maximum absorbance at 410 nm. For panels i–iii, brackets and asterisks indicate significant comparisons. For panel iv, brackets and “ns” indicate non-significant comparisons, where every other comparison had an adjusted p-value less than 0.05 as determined by T-test corrected for multiple comparisons with the Bonferroni correction.

