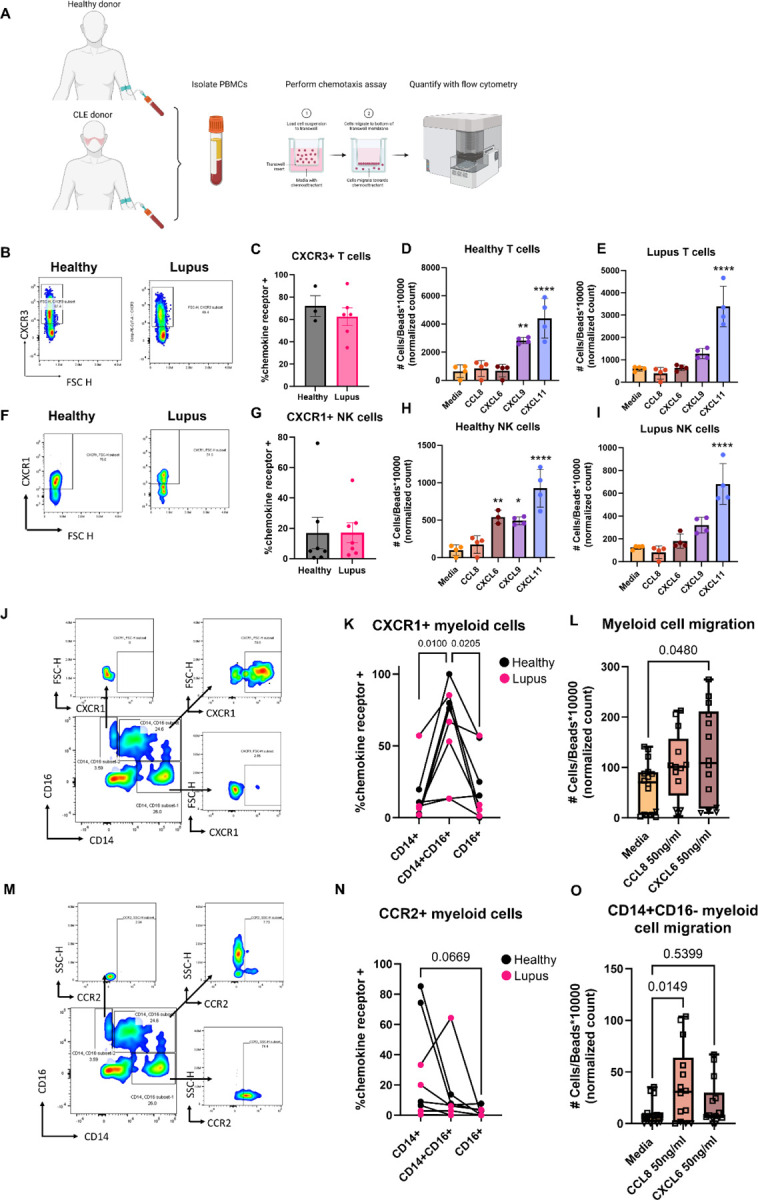
Fig. 6. Functional chemotaxis assays reveal that both healthy and lupus T cells are poised to respond to CXCR3 ligands, whereas CD14+CD16+ myeloid cells are poised to respond to CXCL6 via CXCR1 and CD14+CD16- myeloid cells are poised to respond to CCL8 via CCR2.

(A) To determine functional output, we performed chemotaxis assays on PBMCs from healthy or CLE donors. Created with Biorender.com. (B) Example flow staining and (C) quantification of CXCR3 on CD3+ T cells (n=3 healthy and n=6 CLE, t test ns). (D) Representative chemotaxis assay for healthy and (E) CLE donor T cells reveals directed migration towards CXCL9 and CXCL11, though the ligands are not turned on in healthy skin (**p<0.01 and ****p<0.0001 by one way ANOVA with Dunnet’s post hoc tests versus media control; donors assayed in quadruplicate; wells were excluded if a bubble was present that precluded migration). (F) Example flow staining and (G) quantification of CXCR1 on CD56+ natural killer (NK) cells from healthy and lupus PBMCs (n=7 healthy and 7 lupus donors, t test ns). (H) Healthy donor and (I) lupus donor directed migration reveals NK cells migrate to both CXCR3 ligands, with donor variable responses towards CXCL6. (**p<0.01 and ****p<0.0001 by one way ANOVA with Dunnet’s post hoc tests versus media control; donors assayed in quadruplicate; wells were excluded if a bubble was present that precluded migration). (J) Example flow staining of myeloid cells demonstrating CXCR1 expression in CD14+, CD14+CD16+ and CD16+ gates. (K) Quantification of CXCR1+ cells demonstrates CD14+CD16+ cells express more CXCR1 than their counterparts. (n=4 healthy and 4 lupus donors; p=0.01 and 0.0205 by repeated measures one way ANOVA matched by donor, with Tukey’s post hoc tests). (L) Chemotaxis assays demonstrate that CD14+ cells migrate towards CXCL6 (n=3 healthy donors denoted by squares and n=1 lupus donor denoted by triangles assayed in triplicate or quadruplicate; one way ANOVA with Dunnet’s post hoc tests compared to media control was significant p=0.048 for CXCL6 but not CCL8. Note that lupus donor chemotactic indices for myeloid cells were lower, but still followed the same trends as healthy donors, likely due to their medications). (M) Example flow staining of myeloid cells demonstrating CCR2 expression in CD14+, CD14+CD16+ and CD16+ gates. (N) Quantification of CXCR1+ cells demonstrates CD14+CD16- cells are trending towards more CCR2 expression than their counterparts (n=4 healthy and 4 lupus donors; p=0.0669 by one way ANOVA with Tukey’s post hoc tests). (O) Chemotaxis assays demonstrate that CD14+CD16- cells migrate towards CCL8. (n=3 healthy donors denoted by squares and n=1 lupus donor denoted by triangles assayed in triplicate or quadruplicate; one way ANOVA with Dunnet’s post hoc tests compared to media control was significant p=0.0149 for CCL8 but not CXCL6).
