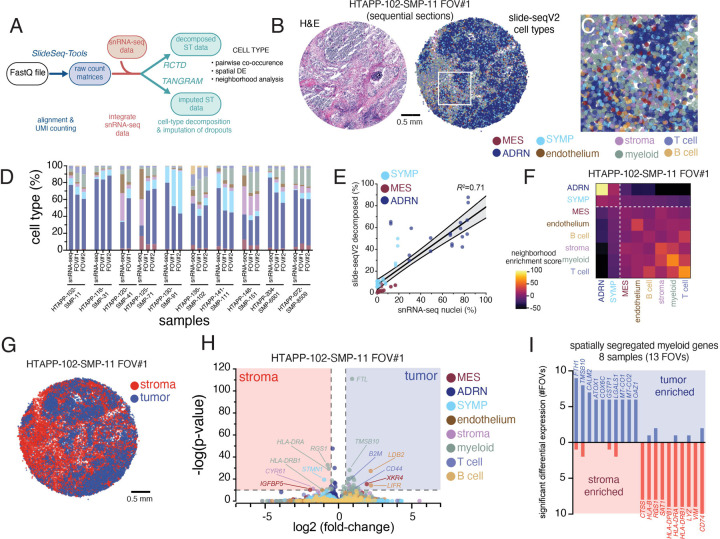
Figure 8. High resolution spatial transcriptomics with Slide-SeqV2 demonstrates myeloid reprogramming within neuroblastoma.
(A) Data processing workflow for Slide-Seq v2 data. Slide-SeqV2, after alignment and UMI counting, underwent both cell type decomposition and zero-count imputation. For both analyses, analogous snRNA-seq from the same tumor fragment was employed to define cell types or expression modules.
(B) An example Slide-SeqV2 array from HTAPP-102-SMP-11. On the left, an adjacent frozen section was processed by H&E staining. On the right, a Slide-SeqV2 array colored based on cell type after decomposition with RCTD79.
(C) Magnified view of the HTAPP-102-SMP-11 field-of-view (FOV) #1 from panel B.
(D) Comparison of cell composition from snRNA-seq data and Slide-SeqV2 assays. 17 Slide-SeqV2 datasets were generated from 10 specimens. The colors of the bars match up with the legend in panels B and C.
(E) Scatterplot comparing the percentage of malignant cell states within single-nucleus RNA-seq data (x-axis; n=10) to the percentage of measured within each decomposed Slide-SeqV2 FOV (y-axis; n=19).
(F) Cell-cell interaction cluster-map of cell types showing the frequency that two cell types are adjacent to each other.
(G) Tumor-rich and stroma-rich compartments, defined after clustering. Tumor-rich areas were defined as Slide-SeqV2 beads with >50% malignant cell composition while stroma-rich areas were defined as Slide-SeqV2 beads with <50% malignant cell composition.
(H) Volcano plot of CSIDE differential expression analysis comparing cell-type expression patterns between tumor-rich and stroma-rich compartments.
(I) Bar plot of recurrent myeloid genes that are enriched in tumor-rich myeloid cells or stromal-rich myeloid cells. The y-axis represents the frequency that significant enrichment was detected (out of 13 evaluated FOVs).

