
Figure 4. Molecular determinants of HKU1 utilization of human TMPRSS2 and host receptor tropism.
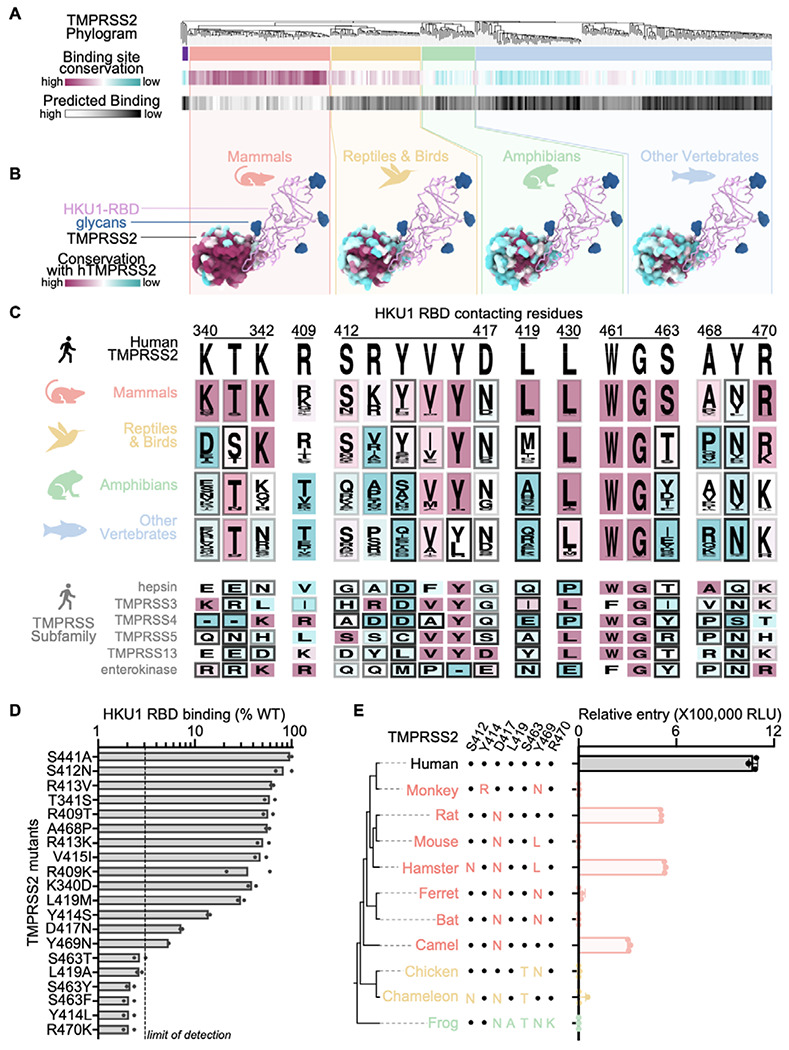
(A, top) Neighbor-Joining phylogram of TMPRSS2 orthologs, clustered in red (mammals), yellow (reptiles/birds), green (amphibians), and blue (other vertebrates). The tree is rooted (far left, purple) on TMPRSS3 4, 5, and 13. (A, middle) The average amino acid sequence conservation (BLOSUM62) of the HKU1 RBD-contacting residues in each TMPRSS2 ortholog, relative to human TMPRSS2, is rendered from maroon (conserved) to cyan (not conserved). (bottom) As a proxy for predicted binding compatibility, the ProteinMPNN47 probability score of the HKU1 RBD-contacting residues in each TMPRSS2 ortholog was calculated and rendered from white (highest score, eg. human TMPRSS2) to black (lowest score). (B) Average amino acid sequence conservation (BLOSUM62) with human TMPRSS2 (hTMPRSS2) of residues from the TMPRSS2 clusters in (A) plotted on the surface of the human TMPRSS2 structure and rendered from maroon (conserved) to cyan (not conserved). The HKU1 RBD is shown as pink ribbons with N-linked glycans rendered as blue surfaces). (C) Logo plots of amino acids equivalent to the TMPRSS2 residues interacting with the HKU1 RBD from the ortholog clusters in (A) and from members of the TMPRSS protease subfamily colored by conservation with human TMPRSS2 from maroon (conserved) to cyan (not conserved). The shade of the frame for each residue represents the predicted binding score from proteinMPNN. (D) Binding of TMPRSS2 point mutants (corresponding to polymorphisms identified in TMPRSS2 orthologs or in humans) to the HKU1 RBD immobilized on biolayer interferometry SA biosensors. Data are shown as the area under the binding response curve normalized to the signal of WT TMPRSS2. Data are shown as the mean of two technical replicates presented in Figure S5. Dashed line shows the practical limit of detection. (E) HKU1 S VSV entry into HEK293T cells transiently transfected with one of the indicated TMPRSS2 orthologs. Key TMPRSS2 amino acid residues interacting with the HKU1 RBD are indicated to highlight conserved and divergent positions relative to human TMPRSS2. Data are shown as the geometric mean and standard deviation of three technical replicates.