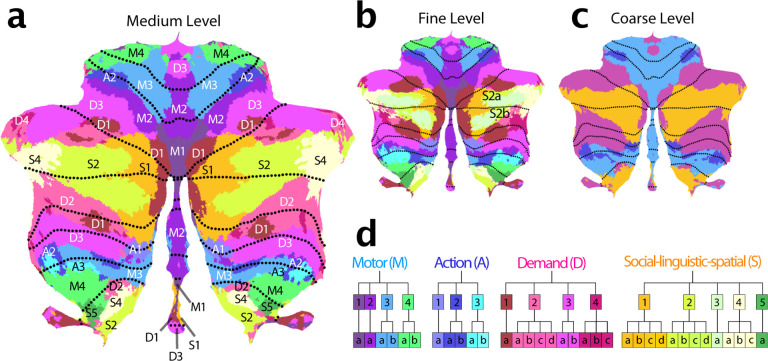
Figure 2. Cerebellar functional atlas at three levels of granularity.
a, Medium granularity with 32 regions; 16 per hemisphere. The colormap represents the functional similarity of different regions (see methods: parcel similarity and clustering). b, Fine granularity with 68 regions; 34 per hemisphere. c, Coarse granularity with 4 functional domains. The symmetric version of the atlas is shown, for the asymmetric version, see Fig. 4. d, Hierarchical organization based on the functional similarity of regions, depicted as a dendrogram. The label of each region indicates the functional domain (M,A,D,S), followed by a region number (1–4), and a lower-case letter for the subregion (a–d).

