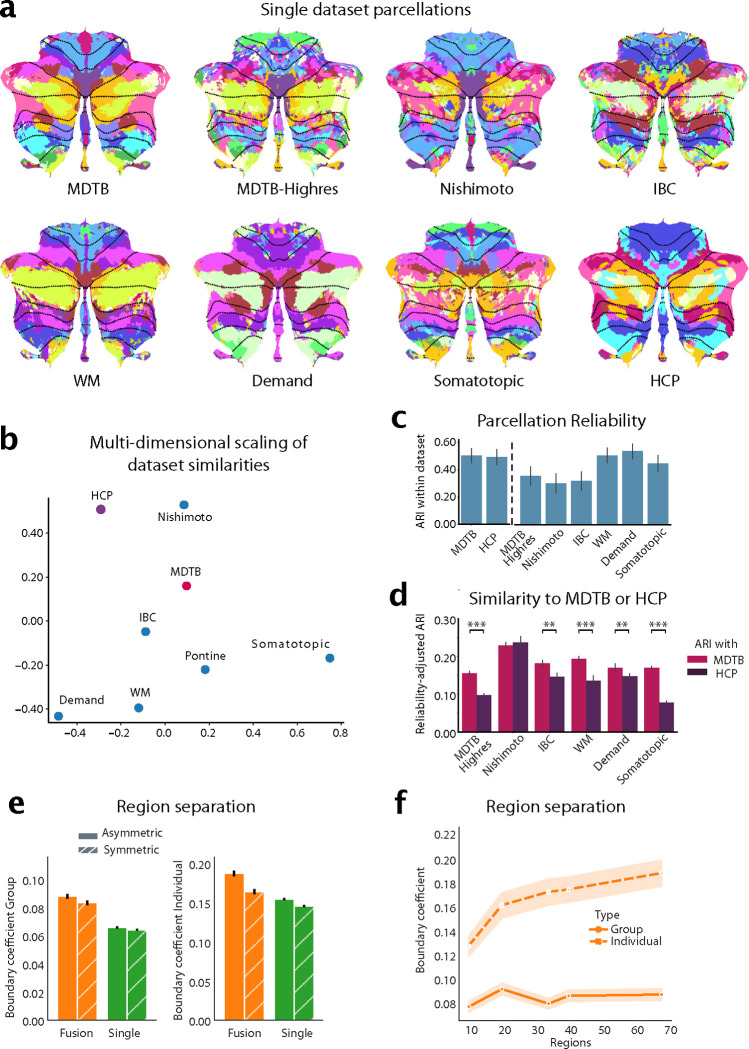
Figure 1. Building a functional atlas of the cerebellum across datasets.
a, Parcellations (K=68) derived from each single dataset. The probabilistic parcellation is shown as a winner-take-all projection onto a flattened representation of the cerebellum [19]. Functionally similar regions are colored similarly within a parcellation (see methods: parcel similarity) and spatially similar parcels are assigned similar colors across parcellations. Dotted lines indicate lobular boundaries. b, Projection of the between-dataset adjusted Rand Index (ARI) of single-dataset parcellations into a 2d-space through multi-dimensional scaling (see methods: Single-dataset parcellations and similarity analysis of parcellations). c, Within-dataset reliability of parcellation, calculated as the mean ARI across the 5 levels of granularity (10, 20, 34, 40 and 68 regions). Errobars indicate SE of the mean across granularity pairs). d, Reliability-adjusted ARI between each single-dataset parcellations and the MDTB (task-based) and HCP (resting parcellation) parcellation. Errorbars indicate standard error of the mean across levels of granularity, ** p < 0.01, *** p < 0.0001. e, DCBC evaluation of the symmetric and asymmetric atlas averaged across granularities evaluated on the group map (left) or on individual maps derived with that atlas (right). f, DCBC evaluation of the symmetric group map and of individual maps derived from the model with 10, 20, 34, 40, and 68 regions.

