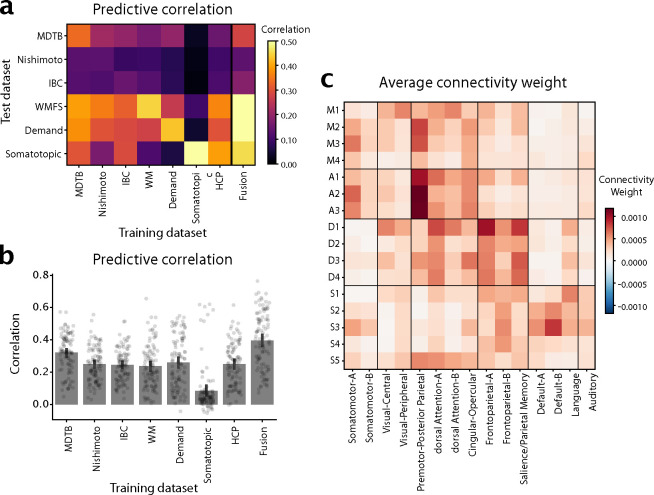
Figure 3. Cerebro-cerebellar connectivity models.
a, Matrix shows the correlation between observed and predicted cerebellar activity patterns for each test dataset (rows). Connectivity models were trained on each training datasets (columns) separately. Evaluation was cross-validated across subjects when training- and test-dataset were identical. b, Correlation between observed and predicted activity patterns, averaged across test-datasets. The Fusion model used the average connectivity weights across all task-based datasets (excluding the HCP resting-state data). c, Average connectivity weights between each cerebellar region (row), and each of the 15 resting-state networks as described in [29].

