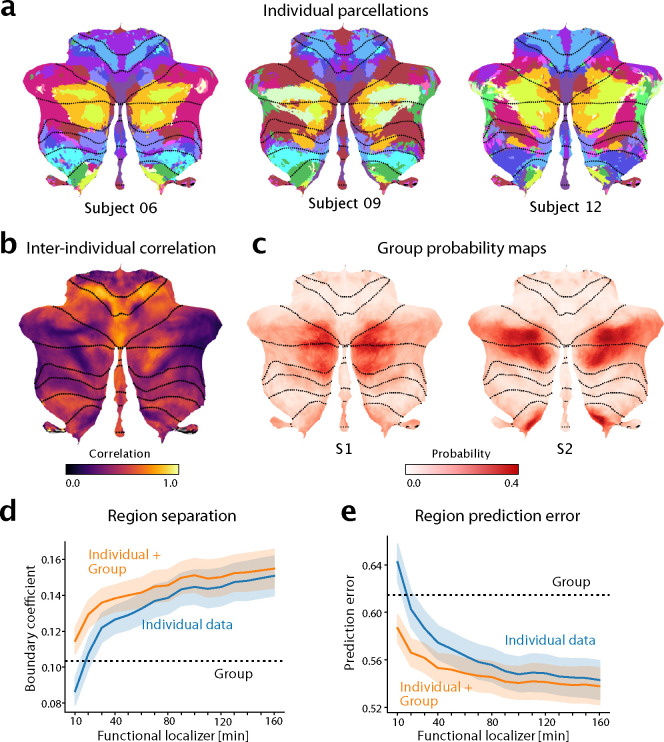
Figure 5. The functional atlas improves individual precision mapping.
a, Individual parcellations from three participants, using 320min of individual data. The region colors correspond to the atlas at medium granularity (32 regions). b, Map of the average inter-subject correlations of functional profiles. Correlations are calculated between any pair of subjects in the MDTB dataset, corrected for the reliability of the data (see methods: Inter-individual variability). c, Group probability map for regions S1 and S2 (left and right combined) show the overlap of regions. d, DCBC evaluation (higher values indicate better performance) on individual parcellations (blue line) derived on 10–160min of individual functional localizing data, compared to group parcellation (dashed line) or the combination of group map and individual data (orange line). e, Equivalent analysis using prediction error (see methods, lower is better).

