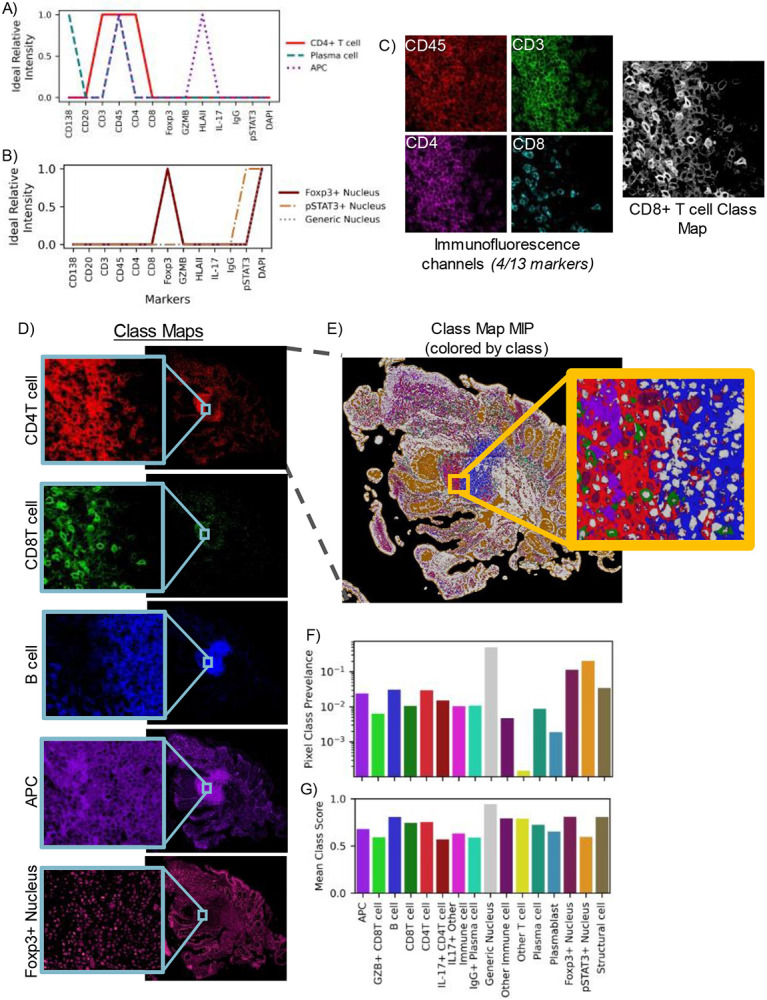
Figure 2.

High-plex images are compressed into class representations maintaining full spatial scale using pseudo-spectral angle mapping (pSAM). Reference pseudospectra are designed for each imaging experiment. These references are specific to cell compartments such as the nucleus (A) or cell membrane (B), based on the molecular target of the marker. Aligned fluorescence images are used to generate similarity maps for each reference pseudospectrum (C). Four markers (CD3, CD45, CD4, CD8) are displayed in (C), but all thirteen channels are used to calculate the class maps. The pSAM class maps show the similarity of pixels to each cell type without the need to compare relative expression across multiple image channels in sample S1 (D). Given the maximum value at each x/y location, individual cells of different populations are clearly visible, even in densely packed areas (E). For the sample shown in (E), the prevalence of each pixel class within the tissue is calculated (F). The average cosine similarity score for each class of pixels in this example image is shown in (G). Prevalence and average score (F-G) are calculated over the pixels that fall within the tissue mask, while the slide background is filtered out as background (black in E).
