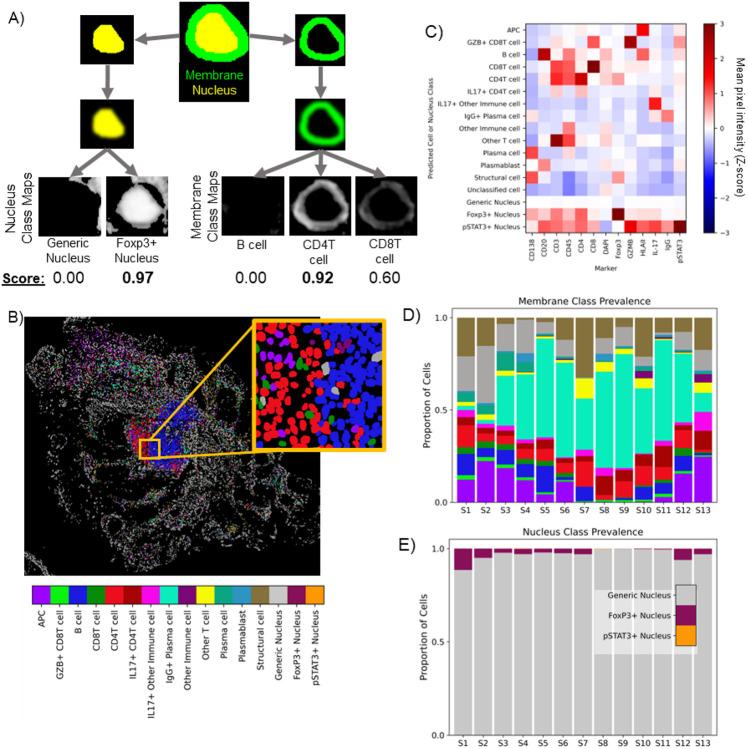
Figure 3.
Class maps are combined with instance segmentations of cells to classify cells (A). Segmented nuclei and a dilated ring around each nucleus are used to mask class maps to generate class scores for each detected cell. The maximum score in each compartment is used to assign a compartment-specific class. Classifications based on cell membrane markers are shown for sample S1 in (B). Cell classes were validated using the mean pixel intensity (MPI) for all channels for each cell. MPI was z-scored across the full PSC dataset (thirteen biopsies, ~885K cells), and the average Z-score for each channel is calculated for each cell class across all samples (C). Note that all cells receive a membrane class (top 13 rows) and a nucleus class (bottom 3 rows). Across the thirteen samples in the PSC dataset, pSAM detected varying distributions of cell classes in the membrane compartment (D) and the nucleus compartment (E). Notably, the generic nucleus class (gray) is a strong majority of cells, and pSTAT3+ nuclei (orange) are rare, but present and detectable in a few samples. The color bar in panel (B) is also applicable to panels (D) and (E).

