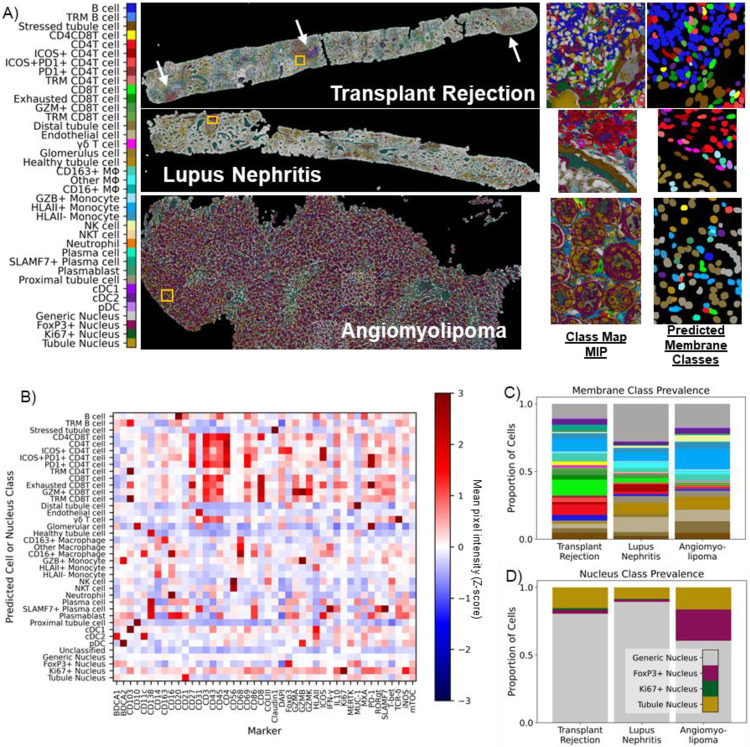
Figure 4.
pSAM is readily generalizable to new datasets. A) pSAM was run on three kidney samples from a dataset stained with a 43-marker panel, each coming from a patient with a unique diagnosis. pSAM was used for cell classification in these three samples, with each cell receiving a class assignment for one of 35 membrane classes and one of four nucleus classes. White arrows in the transplant rejection image point to large clusters of lymphocytes. B) The z-score of the population mean pixel intensity (MPI) for all stains in the 43-marker panel is compared across all cell membrane and nucleus classes. Note that all cells have both a membrane class and a nucleus class. C) A comparison of the relative populations in each sample shows that the immune populations detected shows a diverse and abundant population of immune cells, corresponding with visual inspection of the images. Similarly, tubule and generic nuclei, (gold and gray, respectively) are by far the most abundant nuclei in all three samples (D). Notably, Foxp3 shows cross-reactivity in many tubules in the kidney particularly in the angiomyolipoma sample (A, class map). This is reflected in the cell classification with an overabundance of Foxp3+ nuclei detected. For clarity, cell classes are color by a broader umbrella depending on their lineage (structural cells in brown, B cells in blue, CD4 T cells in red, etc.). The color bar in (A) is also applicable for panels (C) and (D).

