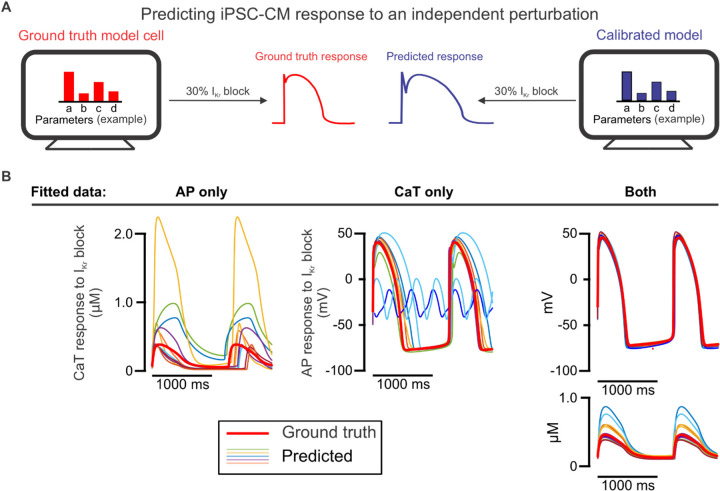
Figure 3: Prediction of iPSC-CM response to an independent perturbation differentiates the models calibrated to AP and CaT simultaneously from those calibrated to single traces.
(A) Schematic illustrating the evaluation of calibrated models on their ability to predict an independent response. (B) AP and/or CaT responses to 30% IKr block predicted by 10 calibrated models for one model cell (thinner traces), compared with the true response of the corresponding model cell (thicker red trace).

