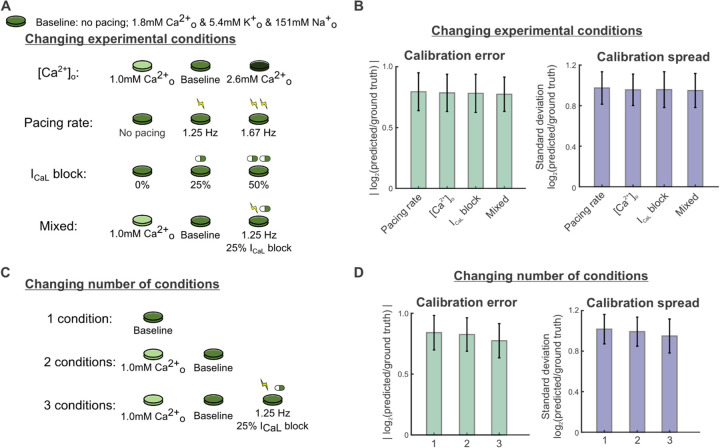
Figure 4: Varying the types and number of experimental conditions has minimal effect on overall calibration error and spread.
(A) Schematic of candidate protocols to generate data for model calibration: varied buffer calcium concentration, varied pacing rates, varied ICaL, block levels, and a mixture of the 3. (B) Parameter errors and spreads from calibration runs for 4 Kernik model cells, using calibration data from each protocol in Fig. 4A. Bar plots show the mean calibration errors and spreads over all 16 fitted parameters from 40 calibration runs (10 runs per model cell). Error bars represent standard deviations over these runs. (C) Schematic of candidate protocols to generate data for model calibration: combinations of 1, 2, or 3 parts of the mixed condition protocol. (D) Parameter errors and spreads from calibration runs for 4 Kernik model cells, using calibration data from each protocol in Fig. 4B.

