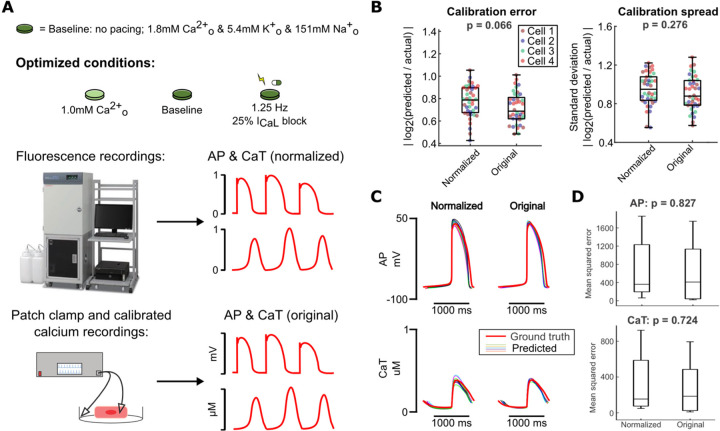
Figure 6: Normalization of calibration data does not significantly affect model calibration results.
(A) Schematic of optimized experimental conditions, normalization of simulated data used to represent fluorescence recordings, and original simulated data used to represent more precise measurement modalities. (B) Parameter errors and spreads from calibration runs on data from 4 Kernik model cells, using either normalized or original data for calibration. Each point represents the average error or spread over all fitted parameters. (C) Predicted AP and CaT responses to 30% IKr block (thinner traces) from each set of conditions, compared to the true response of the corresponding model cell (thicker red trace). (D) Mean squared errors between data points in the predicted traces (simulated using calibrated models) and the actual model cell’s traces, for simulations under 30% IKr block.

