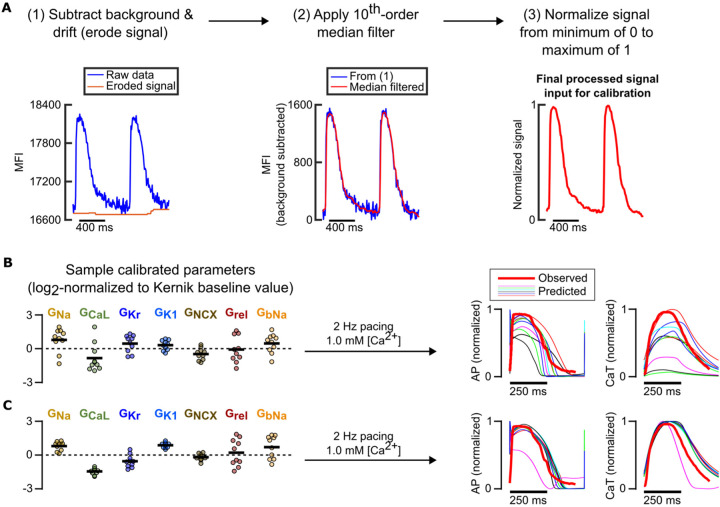
Figure 9: Preliminary model calibrations to in vitro data support findings from in silico calibrations.
(A) Fluorescence recording processing steps in preparation for model calibration pipeline. (B) Resulting calibrated conductance values (left) normalized to Kernik model baseline values (dashed line at 0) and predicted traces under an independent condition (right) when only data from a single condition (physiological buffer, 1.25 Hz pacing) is used to fit parameters. (C) Resulting calibrated conductance values (left) normalized to Kernik model baseline values (dashed line at 0) and predicted traces under an independent condition (right) when data from varied pacing rates and buffer [Ca2+] are used to fit parameters.

