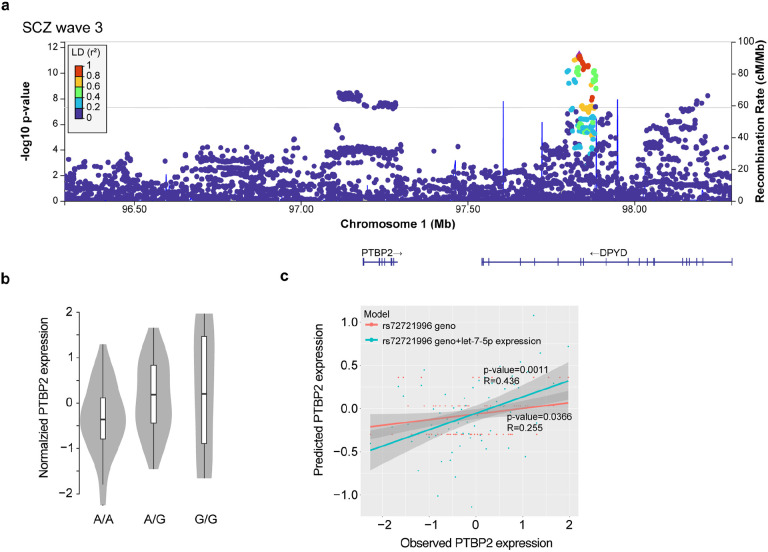
Extended Data Fig. 5. Characterization of the PTBP2 gene.
a, Locus zoom plot of PTBP2 locus showing linkage disequilibrium (LD) scores and −log10 p-value based on SCZ GWAS from the PGC wave 3.
b, Normalized PTBP2 expression levels in iNs from all donors as a function of allele status at the PTBP2 eQTL rs72721996 at the SCZ risk locus PTBP2.
c, Results of linear model-based regression of PTBP2 expression levels in iNs on donor genotype only (red) or donor genotype + miR-let-7-5p expression in the same donors across n=67 samples. X-axis depicts measured PTBP2 expression levels while y-axis shows predicted expression values based on the respective model. P-values indicate significance of the respective model while R values show overall correlation of measured and predicted expression values.

