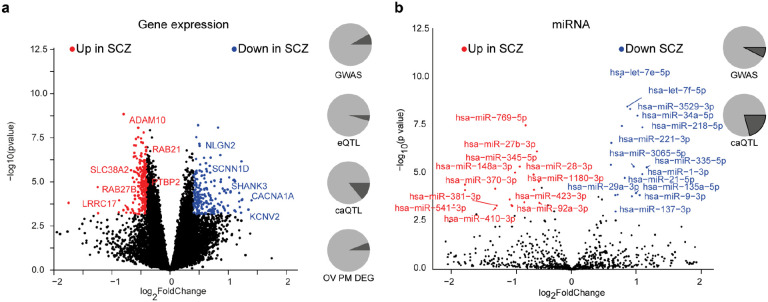
Fig. 2. Differential molecular feature analysis between SCZ and HC iPSC-derived neurons.
a, Volcano plot showing the log2 fold-change (x-axis) and significance (−log10 p-value, y-axis) of differentially expressed genes (DEGs) between SCZ and HC iNs at day 49. Positive fold-changes indicate lower expression in SCZ. Red/blue dots indicate significance (FDR≤0.01) and minimal fold-change (∣fc∣=≥0.4) cutoffs to define DEGs. Text highlights selected genes differentially expressed. Pie charts from top to bottom show: overlap (dark grey) of DEGs with GWAS associated genes, iNs-based eQTLs, iNs-based caQTLs within 100kb and fraction of genes detected as also differentially expressed between HC and SCZ PFC postmortem (p-value ≤ 0.01).
b, Volcano plot showing the log2 fold-change and significance of differential microRNA expression between SCZ and HC iNs at day 49. Positive fold-changes indicate lower expression in SCZ. Red/blue dots indicate significance (FDR≤0.01) and minimal fold-change (∣fc∣≥0.5) cutoffs to define DE microRNAs. Text highlights selected microRNAs DE. Pie charts show overlap (dark grey) of DE microRNAs with GWAS associated genes and iNs-based caQTLs within 200kb.

