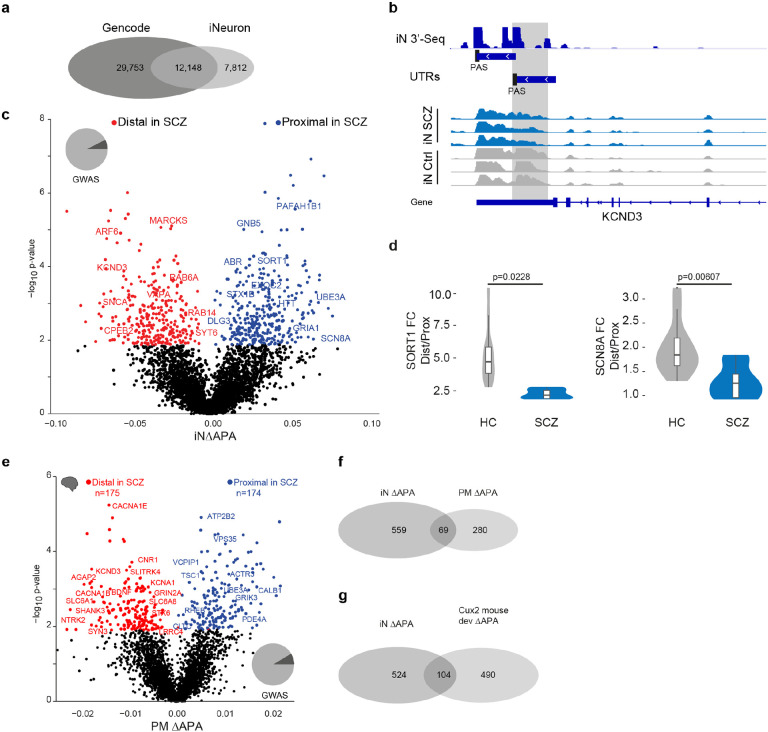
Fig. 3: Alternative 3’UTR polyadenylation in schizophrenia.
a, Overlap of known polyadenylation sites based on the Gencode annotation of the human genome and new polyadenylation sites identified in iNs based on 3’RNA-Seq.
b, Example locus representation of alternative polyadenylation site detection in iNs based on 3’RNA-Seq at the KCND3 locus. From top to bottom: Read count histogram of 3’RNA-Seq in iNs cumulated across 11 donors, detected distinct UTR regions and detected proximal and distal polyadenylation sties (PAS), Read count histograms across individuals iN samples from ISCZ and HC.
c, Volcano plot showing the difference (ΔAPA, x-axis) and significance (y-axis) of differential in 3’APA between ISCZ and HC derived iNs at day 49. Red dots indicate transcripts with a significant (FDR≤0.05) increase in usage of the distal UTR region in ISCZ, whereas blue dots delineate transcripts with a significantly higher usage of the distal UTR in the HC (higher usage of the proximal UTR in SCZ). Text highlights selected genes with dAPA
d, Relative expression values based on qPCR for selected transcripts subjects to dAPA in n=6 iNs from ISCZ and n=6 HC samples in 2 replicates. P-values indicate significance based on LMM t-test.
e, Volcano plot showing the difference (ΔAPA, x-axis) and significance (y-axis) of differential in 3’APA between ISCZ (n=275) and HC (n=291) in adult human postmortem PFC based on bulk RNA-Seq. Red dots indicate transcripts with a significant (FDR≤0.1) increase in usage of the distal UTR region in ISCZ, whereas blue dots delineate transcripts with a significantly higher usage of the distal UTR in the HC.
f, Overlap of transcripts subject to dAPA between ISCZ and HC in iNs and adult PFC.
g, Overlap of transcripts subject to dAPA between ISCZ and HC in iNs and over the course of mouse callosal projection neuron (Cux2 positive) development and maturation.

