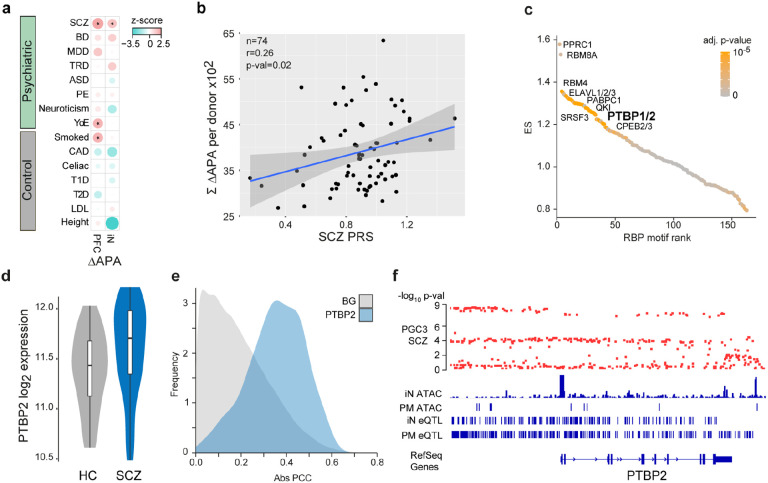
Fig. 5. Association of dAPA with cis- and trans-acting SCZ genetic risk factors.
a, Enrichment of trait heritability for genomic loci of genes subject to dAPA between HC and ISCZ in adult PFC and iNs for a collection of psychiatric diseases and control traits based on GWAS summary statistics and partition heritability analysis. Diseases/traits as indicated (SCZ = schizophrenia, BD = bipolar disorder, MDD = major depressive disorder, TRD = treatment resistant depression, ASD = autism spectrum disorder, PE = any psychotic experience, YoE = years of education, CAD = coronary artery disease, T1D/T2D = Type 1/2 diabetes, LDL = Levels of low-density lipoprotein). Dot size indicates enrichment levels as z-scores and * indicates significance (p-value≤0.05).
b, Relationship of SCZ PRS (x-axis) and cumulated APA (between HC and ISCZ) in iNs across all transcripts showing differential APA (n=628) for each donor (n=74, black dots). P-value indicates significance of linear model fit (blue line) and r the corresponding pearson correlation coefficient. Grey shading signifies standard error of the fit.
c, Distribution of RBP binding motif enrichment enrichment score (ES, y-axis) in the 3’UTR of transcripts subject to dAPA between HC and ISCZ in iNs with increased usage of the distal PAS in SCZ ordered by RBP motif enrichment rank (x-axis). Color code indicates significance of enrichment. Labeling indicates a subset of significantly enriched RBP binding motifs after multiple testing correction (adjusted p-value ≤0.1).
d, Distribution of log2 transformed variance stabilized expression level of PTBP2 in iNs from HC and ISCZ at day 49. P-value/FDR indicate significance of differential expression based on Wald-test.
e, Frequency (y-axis) of absolute pearson correlation coefficient (PCC, x-axis) between APA level of each transcript subject to dAPA (between HC and ISCZ) in iNs (n=628) and respective PTBP2 expression level across all iN samples (blue). For comparison, results from the same analysis for all other expressed RBPs are shown as background (BG, grey).
f, Functional genomic characterization of the PTBP2 locus in the human genome. From top to bottom: Distribution of SCZ association −log10 p-values based on the PGC wave 3 GWAS for all included common variants, ATAC-Seq read count histogram in iNs and PFC from postmortem (PM) human tissue, eQTLs in iNs and eQTLs in PFC.

