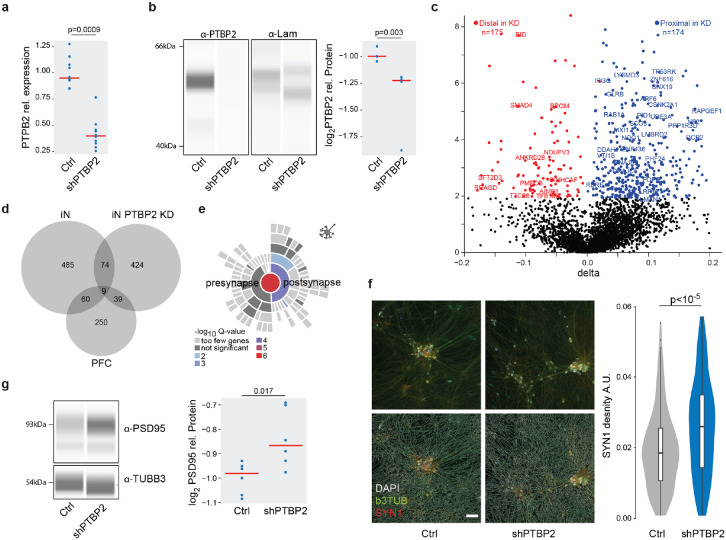
Fig. 6. PTBP2 is a trans-acting genetic risk factor for SCZ mediating dAPA dependent synaptic density alterations.
a, Distribution of relative expression levels (y-axis) of PTBP2 normalized to the housekeeping gene RTF2 in HC derived iNs treated with scramble control and a pool of 4 PTBP2 shRNAs based on qPCR. P-value indicates two-tailed significance level of linear mixed model based comparison of n=20 samples from 3 distinct donors and three independent iN differentiation batches correcting for batch as random effect.
b, Left: Representative visualization of digital quantitative western blot for PTBP2 protein abundance and laminin in scramble control and PTBP2 shRNA mediated knockdown in iNs. Right: Distribution of normalized PTBP2 protein abundance levels (y-axis) in scramble control and PTBP2 shRNA mediated knockdown in iNs based on quantitative western blot. P-value indicates two-tailed significance level of linear mixed model based comparison of n=15 samples from 3 distinct donors and three independent iN differentiation batches correcting for batch as random effect.
c, Volcano plot showing the difference (ΔAPA, x-axis) and significance (y-axis) of dAPA between scramble control (n=2) and acute shRNA mediated knockdown of PTBP2 at the end of the differentiation for 5 days (n=2) in iNs. Red dots indicate transcripts with a significant (FDR≤0.05) increase in usage of the distal UTR region in the knockdown condition, whereas blue dots delineate transcripts with a significantly higher usage of the distal UTR in the scramble control.
d, Overlap of transcripts subject to dAPA between HC and ISCZ in iN or PFC or between scramble control and PTBP2 knockdown in iNs.
e, Enrichment for transcripts subject to dAPA between scramble control and PTBP2 knockdown in iNs in synapse related biological processes based on SYNGO46.
f, Left: Representative image of SYN1 (red) distribution in iNs infected with scramble control shRNA or PTBP2 knockdown alongside with bTub (green) and DAPI (white) signal without (upper line) and with (top line) neurite segmentation mask. Right: Distribution of SYN1 punctae area density (arbitrary units) in neurites of iNs with scramble control or PTBP2 knockdown in iNs from 3 different donors each, 23 wells and 291 fields of view. P-value indicates two-tailed significance level of linear mixed model based testing correcting for donor as random effect. Scale bar indicates 50 μm.
g, Left: Representative visualization of digital quantitative western blot for PSD-95 protein abundance and b3TUB in scramble control and PTBP2 shRNA mediated knockdown in iNs. Right: Distribution of normalized PSD-95 protein abundance levels for high molecular weight (95 kDa) (y-axis) in scramble control and PTBP2 shRNA mediated knockdown in iNs based on quantitative western blot. P-value indicates two-tailed significance level of linear mixed model based comparison of n=10 samples from 3 distinct donors and three independent iN differentiation batches correcting for batch as random effect.

