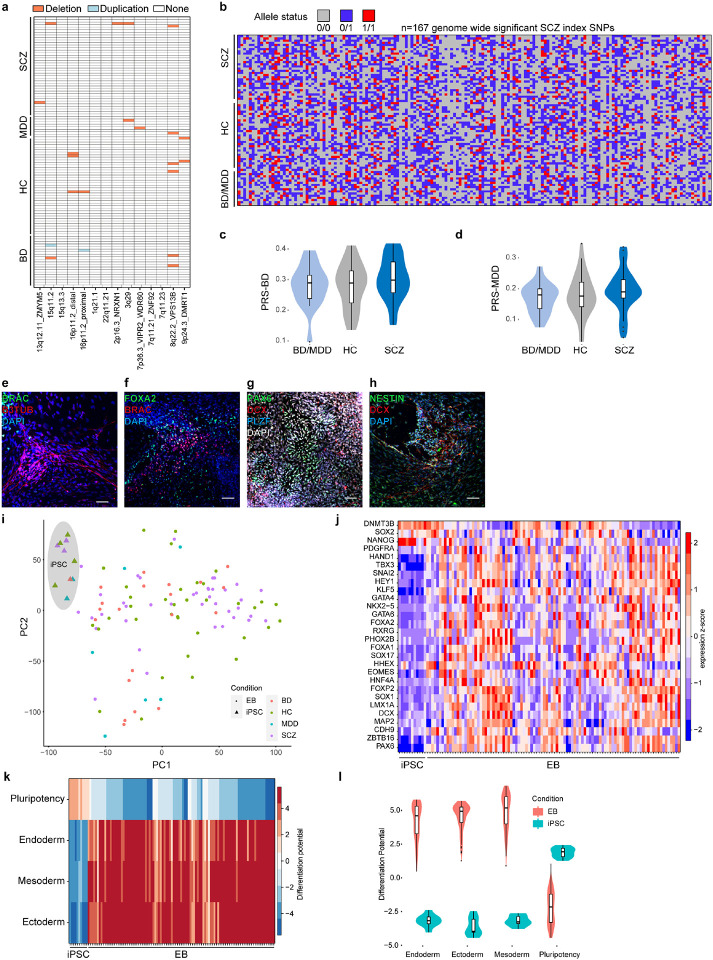
Extended Data Fig. 1. Quality control of iPSCs, and genetic characterization.
a, Distribution of previously identified CNVs associated with SCZ (x-axis) across all iPSC lines ordered by diagnosis group (y-axis).
b, Distribution of index-SNP allele status (color-code) for 167 genome wide significant SCZ associated loci (x-axis) across all iPSC donors.
c, Distribution of the individual polygenic risk score for bipolar disorder for the different diagnosis groups of hiPSC donors.
d, Distribution of the individual polygenic risk score for major depressive for the different diagnosis groups of hiPSC donors.
e, Representative immunofluorescence image of an embryoid body section at day 15 of differentiation colored for mesodermal marker Brachury (BRAC) and ectodermal marker beta-3-tubulin (B3TUB). Scale bar indicates 50 μm.
f, Representative immunofluorescence image of an embryoid body section at day 15 of differentiation colored for endodermal marker FOXA2 and mesodermal marker BRAC. Scale bar indicates 50μm.
g, Representative immunofluorescence image of an embryoid body section at day 15 of differentiation colored for ectodermal markers PAX6, DCX and PLZF. Scale bar indicates 50μm.
h, Representative immunofluorescence image of an embryoid body section at day 15 of differentiation colored for ectodermal markers NESTIN and DCX. Scale bar indicates 50μm.
i, PCA analysis results for RNA-Seq profiles from EBs derived from all iPSC lines (stars) and a subset of iPSC analyzed in the pluripotent state (triangles) colored by diagnosis group.
j, Heatmap of key lineage marker gene expression (y-axis) across all EBs and iPSCs analyzed in this study (y-axis) as z-scores (color scheme) based on RNA-Seq.
k, Cumulated differentiation potential for each germ layer and pluripotency signature assessed (y-axis) by RNA-Seq for EBs (see Methods for details) across iPSC lines (x-axis).
l, Distribution of cumulated differentiation potential signature (y-axis) for each germ layer and the pluripotency signature and (x-axis) across iPSC-derived EBs (red) and a subset of iPSCs (blue).

