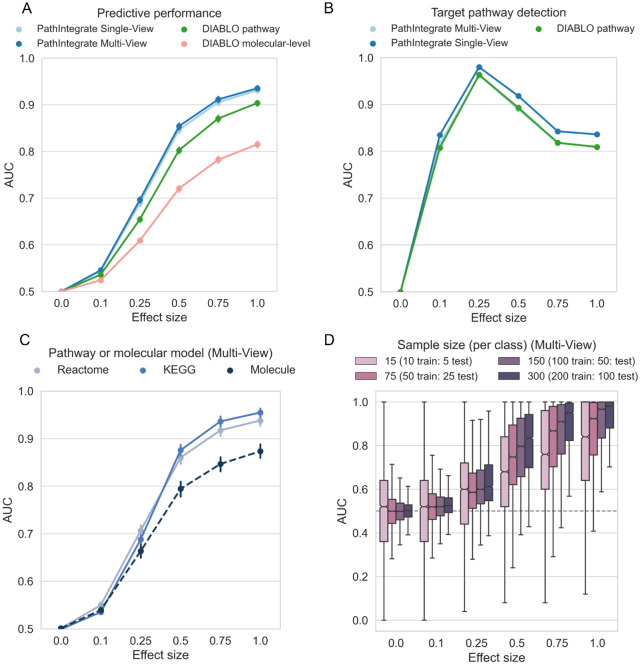
Figure 3: Performance of PathIntegrate and DIABLO vs. effect size, based on semi-synthetic data measured by AUROC.
COPDgene metabolomics and proteomics data were integrated in each model. a. Ability to correctly predict sample outcomes (case vs. control). We compared PathIntegrate Multi-View and Single-View to DIABLO using both molecular and pathway-level multi-omics data. b. Ability to correctly recall target enriched pathway. We compared DIABLO RGCCA model loadings to the Multi-View MB-PLS VIP and Single-View PLS VIP statistics for pathway importance. c. Comparison of PathIntegrate Multi-View classification performance using KEGG and Reactome pathway databases as well as molecular-level model. d. Effect of sample size on PathIntegrate Multi-View classification performance. For panels a-c error bars indicate 95% confidence intervals on the mean AUROC (in some cases they appear smaller than point sizes).

