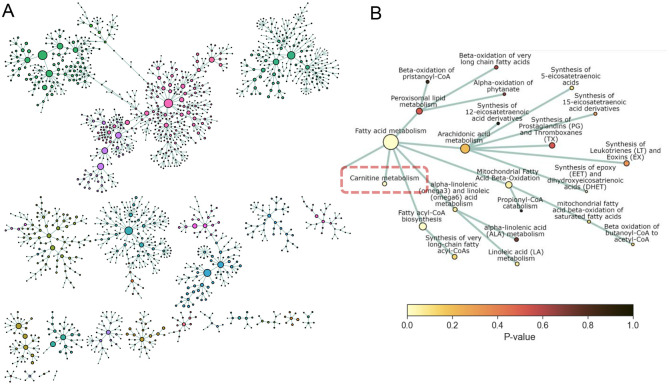
Figure 5: Network visualisation with PathIntegrate interactive network explorer.
PathIntegrate Multi-View was applied to COPDgene multi-omics data. A. Multi-omics network view of global Reactome hierarchy DAG. Only pathways with sufficient coverage (≥ 2 molecules per pathway) are shown as nodes. Edges represent parent-child relationships between pathways as defined by Reactome. Nodes are coloured by Reactome superpathway membership. Node size corresponds to pathway coverage. B. Network view of ‘Carnitine metabolism’ pathway (zoomed-in susbset of (a)) and close neighbourhood within the Reactome pathway hierarchy. Nodes are coloured by p-values obtained from PathIntegrate Multi-View model.

