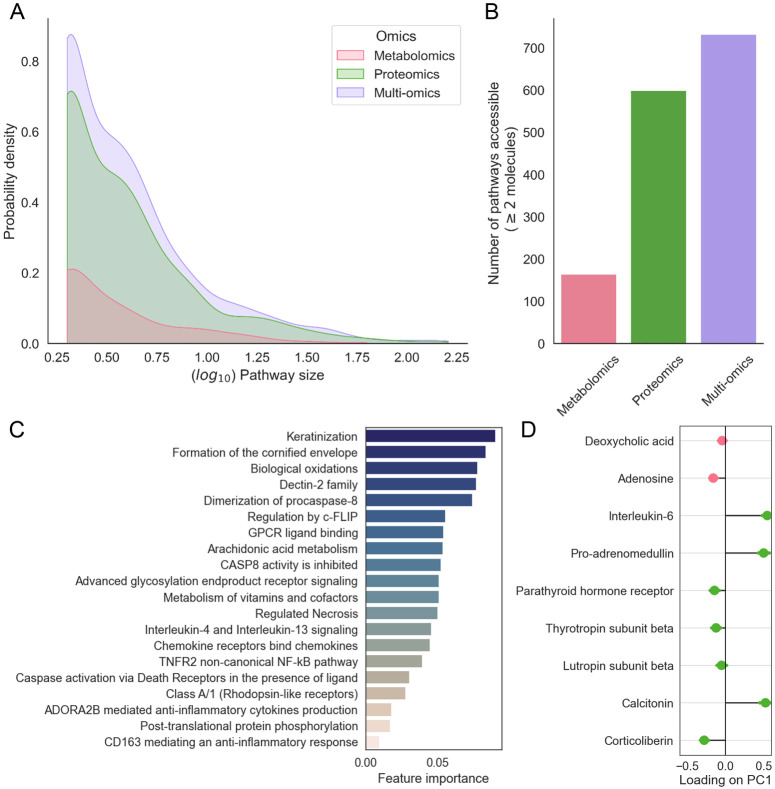
Figure 6: PathIntegrate Single-View applied to COVID-19 multi-omics data.
A. Kernel density distribution of log10 pathway sizes in the COVID dataset per omics view. Pathway size refers to the number of molecules annotated to each pathway present in the COVID datasets. B. Number of pathways with sufficient coverage in the COVID dataset in each omics view. C. Multi-omics pathway features identified using recursive feature elimination from the PathIntegrate Single-View random forest model, ranked by Gini importance. D. Molecular level importances derived from the ‘ADORA2B mediated anti-inflammatory cytokines production’ (R-HSA-9660821) SVD pathway scores. Datapoints represent mean and standard deviation of loadings of each molecule on PC1 across 200 bootstrap samples.

