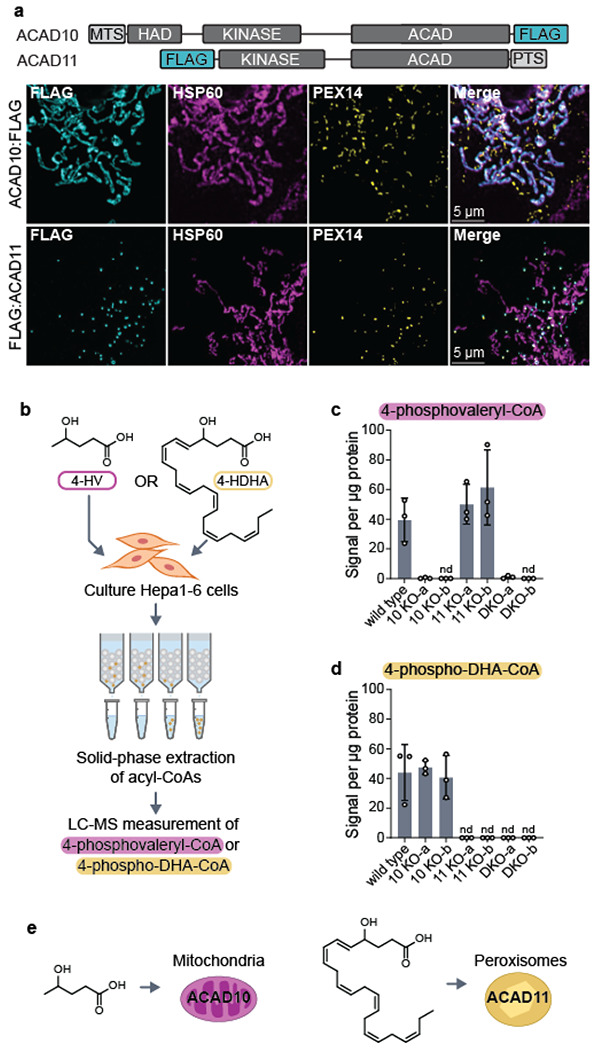
Fig 3. ACAD10/11 mediate catabolism of distinct 4-HAs in different organelles.

(a) Immunofluorescence imaging of overexpressed human ACAD10:FLAG and FLAG:ACAD11 in COS7 cells. Localization of FLAG-tagged constructs (cyan) is indicated by overlap in fluorescence intensity with peroxisomal (PEX14; yellow) and mitochondrial (HSP60; magenta) markers. Location of mitochondrial targeting sequence (MTS) and peroxisomal targeting sequence (PTS) on the full-length isoforms of ACAD10 and ACAD11 are illustrated at the top. (b) Diagram of experimental workflow to test 4-HA metabolism in Hepa1-6 cells. (c) 4-phosphovaleryl-CoA levels detected in Hepa1-6 cells treated with 0 mM or 10 mM unlabeled 4-HV. (d) 4-phospho-DHA-CoA levels detected in Hepa1-6 cells treated with unlabeled 100 μM 4-HDHA conjugated to 1% fatty acid-free BSA (w/v). Results are represented as the mean signal intensity normalized to total μg protein per sample −/+ SD (n = 3 replicate experiments). (e) Model of 4-HA catabolism at an organellar level.
