Figure 3.
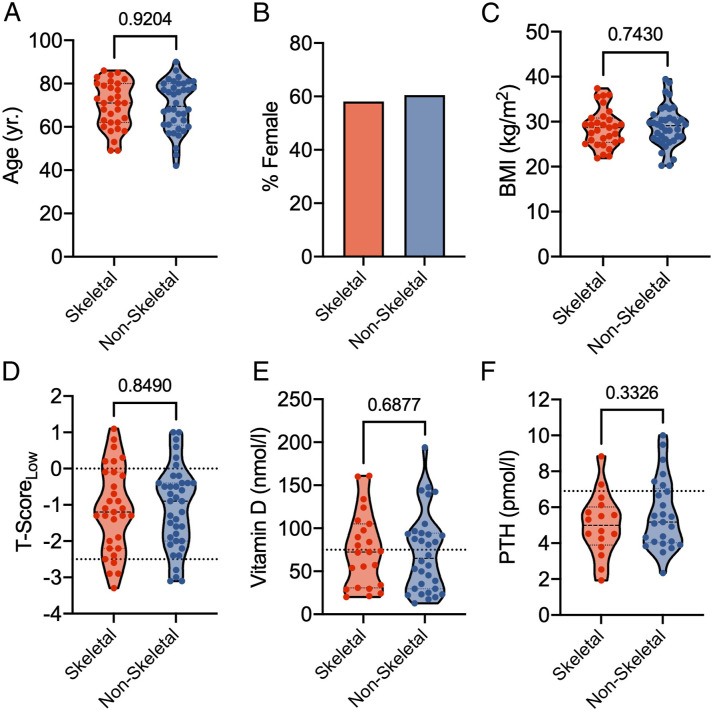
Comparison of demographics, DXA results and laboratory bone metabolism parameters between patients with skeletal and non-skeletal complications after fusion. (A) Comparison of age, (B) sex distribution, (C) BMI, (D) T-score (lowest value of the measuring sites), (E) vitamin D, and (F) PTH. The dashed lines of the truncated violin plots represent the median and quartiles. P-values are given above the diagrams.

