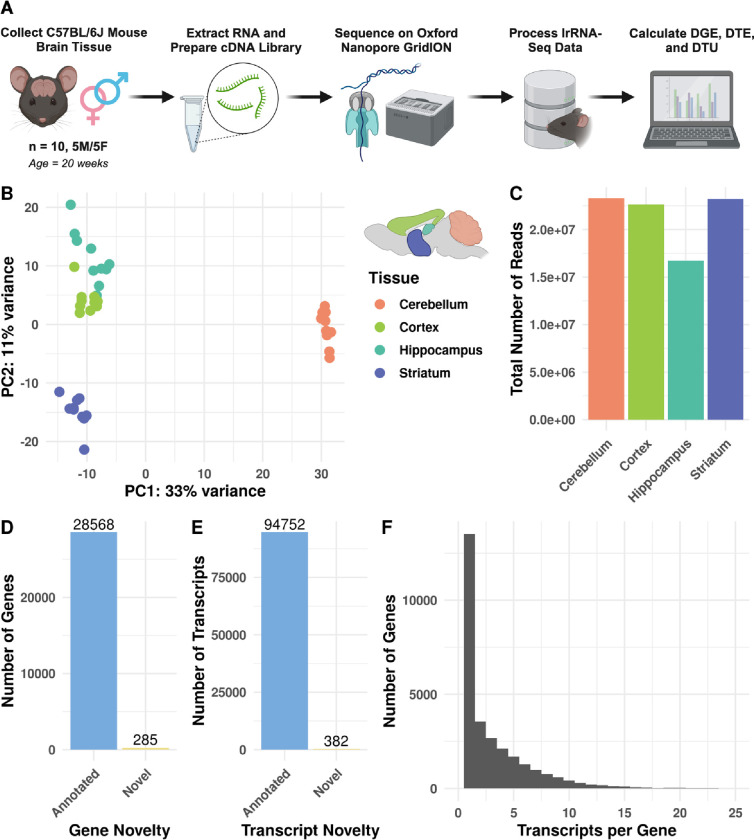
Figure 1. Long-read Nanopore RNA sequencing across four mouse brain regions.
(A) Overview of the study design. (B) PCA plot (PCs 1 and 2) of VST gene counts. Here, we colored samples by brain region. (C) Bar graph of the total number of long reads sequenced for each tissue. (D and E) Bar graphs of the number of novel and annotated genes and transcripts. (F) Histogram of the transcript counts per gene, truncated past 25 transcripts per gene. Supplementary File 2 includes the numbers of all transcripts measured for each gene.

