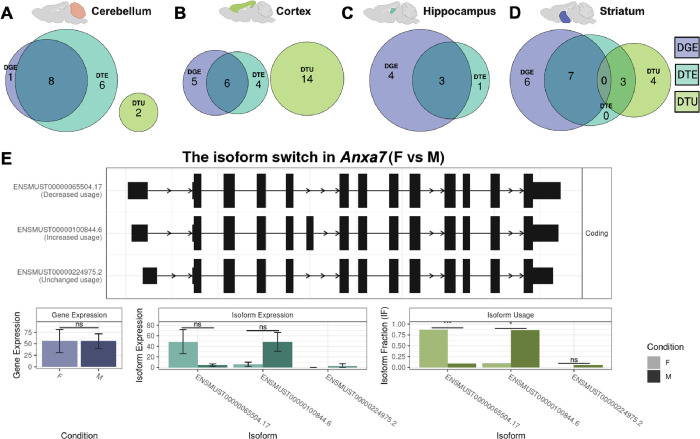
Figure 3. DGE, DTE, and DTU across sex within brain regions.
(A-D) Euler diagrams represent the overlap of genes with significant DGE (Wald test with BH correction p < 0.05, purple), DTE (Wald test with BH correction p < 0.05, cyan), and DTU (analysis of deviance chi-squared test with BH correction p < 0.05, green). The brain regions represented are (A) cerebellum, (B) cortex, (C) hippocampus, and (D) striatum. (E) Switchplot displaying a transcript summary, gene expression, isoform expression, and isoform usage of the gene Anxa7 across male (M; dark color) and female (F; light color) cerebral cortex. In the indicated comparison, ns denotes not significant, * denotes P < 0.05, ** denotes P < 0.01, and *** denotes P < 0.001.

