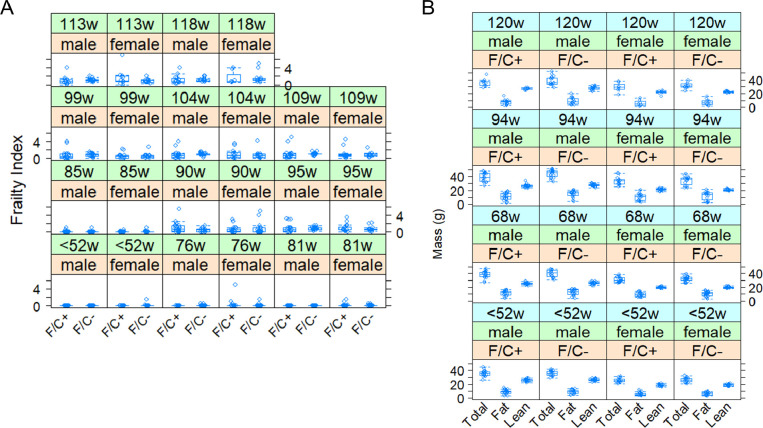
FIGURE 3. No adverse healthspan metrics in mice placed on dietary folate restriction late in life.
(A) Frailty Index scores are shown on the y-axis. Measurements were taken at the indicated times from female and male animals of each diet test group, as described in Materials and Methods. (B) The total, fat, and lean mass of each mouse in the study was measured by MRI (see Materials and Methods), and shown on the y-axis. The boxplots were drawn as in Figure 2.

